“The Creation and Destruction of Value” 価値の創造と破壊 Vol.10

(All the below links are in English.)

Vol.10 金融革命の度合と限界(第4章-3)

 2005年の破産法改正によりCDSやモーゲージレポなどの証券は通常の破産手続無しに畳めるようになったことも、劇的な借り入れブームを誘発した。また、銀行に支配される簿外取引の増加、及び、債務弁済義務が無いかのような曖昧な形の親銀行の借り入れ慣行も、借り入れ増加を助長した。しかし、最も明白な元凶は、2001年の景気停滞に対処するための連銀の急激な利下げと、金融引き締め開始への乗り気薄であったことであった。
 銀行規制は国内市場では比較的機能するが、国境を跨ぐ複雑な取引に対しては相当難しくなる。“too big to fail”となる大規模かつ複雑な構造の銀行が誕生しないように規制をかける必要があった。また、過度の成長と技術革新から生じた危機への対処法は逆説的に更なる技術の発展にある、と銀行の問題についても言える。技術革新により少ない雇用で多くの市場参加者が生じ、生産性が上がりマクロ経済の脆弱性は下がる。
 ただ、金融戦略については技術革新が頼りになるとも言い切れない。例えば、投資銀行は最先端も含めて金融に詳しいので、M&Aのアドバイスをしつつ、証券を発行したり自分にとって良い取引をしていたりもし、これらは債権者などの利益に繋がるとは限らない。最近の心理学の経済学への応用に見られるように、多くの人間の決定は非合理的である。例えば、英国では長く電車の運転には乗員が二人必要だとされていたのでワンマン電車が安全であると公衆を説得するのに時間がかかったが、今は無人運転の電車すらあるくらいである。多分、技術革新は、人間の間違いによる大混乱を回避する上では良いのだろうが。

参考
2005 Bankruptcy Act impacted repos and housing bubble | Mary Fricker, RepoWatch
Banks’ Off-Balance-Sheet Risks Come Under Basel Scrutiny | Jim Brunsden @business
Bank Size and Systemic Risk (PDF) | Luc Laeven, Lev Ratnovski, and Hui Tong @IMFNews
We will put people first, not bankers | Gordon Brown @guardian
Why the French said “non”: Creditor-debtor politics and the German financial crises of 1930 and 1931 (PDF) | Simon Banholzer & Tobias Straumann
Preventing Transboundary Crises: The Management and Regulation of Setbacks (PDF) | Emery Roe @CalStateEastBay
Changes may hurt as much as crisis | Harold James @FinancialNews

ツイッター paper.li Vol.6

All the below links are in English.

弊社ツイッターアカウントの一つ @WSjp_insight のRTによる paper.li 掲載記事5件を貼っておきます。

@RBAInfo Bulletin June Quarter 2016 | @WSjp_insight

A new trade commission has warned the UK to treat China with “kid gloves”, and focus on attempts to secure deals with countries with “similar values” | @MkSands @CityAM

Spain’s Northern Coast by Private Rail | @ffdunlop @NatGeo

LifeSciences grant: 2016 Laureates #iGEM | @FranceScience

Franz Ferdinand, Whose Assassination Sparked a World War | @DSlotnik @nytimesworld

U.K. イギリス Vol.9(Brexit Vol.8: Japan’s Message to UK & EU 日本要望書)

(The below two links are in English, and the last one in Japanese.)

さて、当サイトでも今後、随時、Brexit につき情報をアップして参ります。
本日は、@ChathamHouse 関係の記事 Japan Lays Out a Guide to Brexit (6 September 2016) | Sir David Warren @CHAsiaProg(’日本がイギリスEU離脱の手引きを示す’)本文と抄訳をご紹介します。

– Britain would do well to embrace Tokyo’s constructive criticism as it prepares for life outside the EU.(EU域外での生き方を準備している日本の建設的な批判を、イギリスは包み込んで受け容れてうまくやっていける)

The Japanese government paper on the implications of Brexit released on 2 September has been described in the UK media as an ‘unprecedented’ and ‘dire’ warning, a ‘stark’ threat, and dismissed as ‘doom-mongering’. In reality, it is a carefully-argued and very detailed analysis of the areas of Brexit-related concern to the thousands of Japanese companies in the UK, and those aspects of the current business environment that they want to preserve in the forthcoming negotiations. Setting out the Japanese stall in this way risks annoying British negotiators with the responsibility of finding their way through the minefield of agreeing the terms of Britain’s divorce from Europe. But the Japanese analysis, used constructively, is an important guide to what really matters in ensuring that a post-Brexit UK is not only ‘open for business’, but a country that the world’s major investors want to do business with.
(9月2日に公表されたイギリスEU離脱に係る日本政府の要望書(下記参考英文)は、’前代未聞’で’切迫した’警告であり’正真正銘’の脅しであるとイギリスのメディアでは伝えられており、’恐怖を利用した’と切り捨てられている。しかし、日本の要望書は、イギリスEU離脱に係るイギリス国内の千単位の日本企業にとっての懸念について、また、今後の離脱交渉において日本企業にとって維持されたい現在の企業活動環境について、注意深く議論されまた非常に詳細に分析したものである。… 建設的に使えば、離脱後のイギリスが’企業活動にとって動き易い’のみならず世界の主な投資者が企業活動をしたい国であることを確保するのに真に問題となる事柄についての重要な手引きである。)

The paper is couched in terms of cooperation and partnership. Japanese inward investment into the UK has been one of the major industrial success stories of the last 40 years, with the 1984 decision of Nissan to build its car plant at Sunderland the turning point. The Japanese government and Japanese companies want to preserve this post-Brexit. But that means keeping radical changes to the current environment that might emerge from the Brexit talks to a minimum. Specifically, the Japanese want, among other things, to maintain current tariff rates and customs procedures, access to skills (including from within the EU), the current provision of financial services (50 per cent of the value of British manufactured goods is accounted for by services), the current arrangements for information protection and data exchange, unified intellectual property protection, harmonized standards and regulations, and access to the EU R&D budget and joint programmes. These requests are aimed at EU negotiators as well as at the UK. A 10-page annex goes into even more detail, sector by sector.
(… とりわけ日本が望むのは、関税率、税関手続き、EU域内も含めた人材へのアクセス、金融サービス条項、情報保護及び… →下記参考(日本語PDF3頁等)をご覧ください

The context of these requests is not just concern about Brexit. The paper makes clear that leading the free-trade system remains a responsibility shared by Japan, the UK and the EU. The Japanese government are nervously watching the US presidential election, with Donald Trump openly adopting a protectionist line and Hillary Clinton now opposed to the Trans-Pacific Partnership (TPP) trade deal; they will also have been concerned at suggestions from European politicians that the US−EU Transatlantic Trade and Investment Partnership (TTIP) may fail. Hence their statement – echoed by President Obama at the G20 in Hangzhou in his remarks on TTIP – that the priority must be to finalize the EU−Japan Economic Partnership Agreement this year. A post-Brexit UK−EU relationship that erects protectionist walls would, in Japan’s view, be a disaster for everyone.  The arguments in the paper are about preserving the health of the global economy.
(要望書はイギリスEU離脱への懸念を示しているだけではない。引き続き自由貿易をリードしていくことが日英欧において共有される責任であることが明確にされている。日本政府はアメリカ大統領選挙を神経質に見守っている。…)

And Japan calls for early clarity and transparency on the difficult issues.  The paper argues that uncertainty causes volatility, and warns against the negotiating process producing ‘unpleasant surprises’. This advice may be unwelcome to UK politicians and negotiators who have to work out how to trade off being part of the single market with the need to restrict freedom of movement.   This is a political dilemma that needs to be unravelled slowly; Britain’s economic partners’ need for early clarity runs directly counter to the politics which Prime Minister Theresa May and her cabinet have to manage over the coming months.
(そして日本は、難しい案件につき早期の明確化及び透明性を求めている。不確実性が市場の急激な変動を引き起こすと述べ、また、交渉過程が’嬉しくないサプライズ’をもたらすことを警告している。このアドバイスは、単一市場の一部であることと移動の自由を制限することの折り合いをいかに付けるかに尽力せねばならない政治家や交渉者からは、歓迎されないものかもしれない。これは、ゆっくりほどけて行かざるを得ない政治的ジレンマなのであるから。…)

The paper observes that ‘Japan respects the will of the British people as demonstrated in the referendum’ and express confidence that ‘the UK and the EU will overcome . . . difficulties and lay the foundations for the creation of a new Europe’. Nonetheless, the menu of requests is challenging and almost certainly impossible to fulfil in its entirety, if, as the prime minister has said, ‘Brexit means Brexit’. But it is a guide to what foreign businesses, attracted to the UK by successive governments with the promise of being inside the single market in an EU member state committed to further trade liberalization, want from the new arrangements. 
(要望書では、’日本はイギリス国民の投票の意思を尊重する’と述べられ、また … にもかかわらず … しかし、これは、外国企業がイギリスの今後の交渉過程において整えてもらいたいことに係る手引きなのである。…)

In that sense, it should also lift the level of current discussion on trade and investment relations away from the zero-sum political arguments during the referendum campaign – ‘being part of Europe’ versus ‘free trade agreements with the rest of the world’.  Japan is saying, very clearly, that it is not an either/or choice. If the UK is to remain one of the world’s largest and most powerful economies – which, however much it is talked down in Britain, it still is – it is going to have to have a relationship with the EU that attracts foreign investors. After all, as the paper also makes clear, they have a choice where to invest. It does not have to be the UK.
(この意味では、この要望書は、国民投票キャンペーンで展開されたゼロサムの政治的議論ー’欧州の一部’か’欧州以外の世界各国との自由貿易’かーから、貿易や投資の関係に係る議論のレベルを高めるものである。日本は、非常にはっきりと、どちらかを選ぶ選択ではない、と言っている。もしイギリスが世界で最大最強の経済の一つであり続けるならば、外国投資家を惹き付けるイギリスとEUとの関係を持っているであろう。結局、要望書がこれまた明確にしているように、どこに投資するかの選択の自由があるということである。イギリスへ投資しなければならない、ということではない。)

参考
Japan’s Message to the United Kingdom and the European Union (PDF)
英国及びEUへの日本からのメッセージ(PDF、日本語)

Australia オーストラリア Vol.4

(All the below links are in English.)

オーストラリア中央銀行 Reserve Bank of Australia の 2016年第2四半期 Bulletin June Quarter 2016 | @RBAInfo をご紹介します。

1. Household Wealth in Australia: Evidence from the 2014 HILDA Survey | Paul Ryan and Tahlee Stone(オーストラリア国民の家計の財産状態)

[概要abstract]
This article uses data from the Household, Income and Labour Dynamics in Australia (HILDA) Survey* to assess how the distribution of wealth changed for Australian households between 2010 and 2014. Average household wealth increased modestly over that period, driven mainly by growth in the value of financial assets, most notably superannuation. The growth of housing wealth was slow in comparison, particularly in Queensland and Western Australia. While most of the changes in wealth were broadly based across households, wealth increased more rapidly for those residing in New South Wales and for retired households with large holdings of superannuation and equity assets.
(本論文は、オーストラリア家計収入労働関係性HILDA調査のデータを使って、2010年から2014年の間のオーストラリア国民の富の分配の変化を評価している。この期間、主に、金融資産価値、最も知られているものでは退職年金の増加によって、平均的な家計の富は緩やかに増加した。特にクイーンズランド州や西オーストラリア州では伸びは鈍い一方、ニューサウスウェールズ州では急速に伸びた。)
** Australian System of National Accounts (ASNA)
*** Australian Bureau of Statistics (ABS) Survey of Income and Housing (SIH)

[補足・抜粋/excerpts]
Introduction
… As the general distribution of household wealth (i.e. total assets minus total debts) across, these categories is broadly the same in 2014 as it was in 2010, this article focuses on how the distribution of housing assets (including investment properties), non-housing assets (predominately superannuation) and household debt have changed between 2010 and 2014.
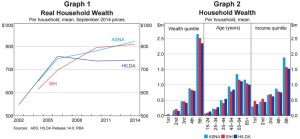
The HILDA Survey* data suggest that the average Australian household had total wealth of around $740 000 in 2014. Measures of real (inflation adjusted) wealth per household from the HILDA Survey grew a little less over the decade to 2014 than measures based on household-level data from the SIH*** and distributional wealth indicators from the ABS that are consistent with aggregate data from the ASNA** (Graph 1).
graph12
Looking at the cross-sectional distribution of household wealth, older and higher-income households tend to have higher levels of wealth (Graph 2). …

Household Wealth
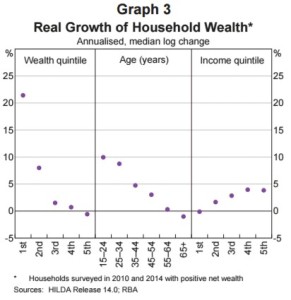
Overall, almost 60 per cent of households in the HILDA Survey had more real wealth in 2014 than was the case in 2010. Households with the lowest levels of wealth in 2010 saw the most growth of wealth over the four years to 2014 (Graph 3). This partly reflects the fact that low-wealth households are generally young and are just starting to build wealth. …
graph3

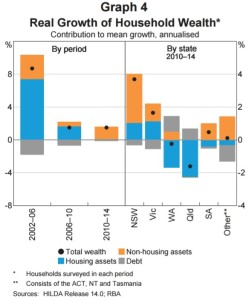
… most of the increase in wealth over the 2010–14 period came from growth in the value of non-housing assets, which are predominantly financial assets such as superannuation, equities and deposits (Graph 4). …
graph4

… Households in New South Wales and Victoria saw the largest increase in wealth, with growth in both housing and non-housing assets, while households in Queensland and Western Australia saw the biggest decrease in wealth, on average, mainly owing to a fall in the value of housing assets. The other states and territories generally saw relatively little growth in wealth over the period. The outcomes for households in Queensland and Western Australia are likely to have been influenced by the decline in commodity prices and the mining investment boom following the peak, which occurred between 2010 and 2014. …

Housing Assets
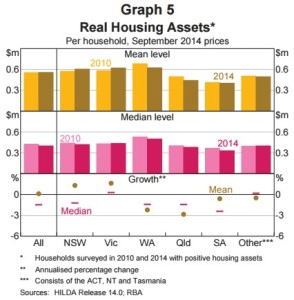
Housing is the largest asset class on Australian households’ balance sheets, accounting for around 60 per cent of total assets. Over any given period, growth in housing assets can be due to a change in housing prices or a change in the stock of housing held by Australian households. …Looking more closely across the states reveals large differences in the mean and median values of housing assets (Graph 5). …
graph5

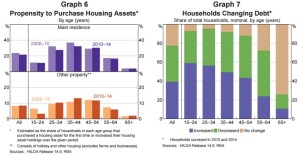
… the share of households that either became home owners for the first time or upgraded their main residence decreased relative to the 2006–10 period (Graph 6). …Households in New South Wales and Victoria were slightly more likely to increase their holdings of other property than was the case from 2006 to 2010.
graph67

Household Debt
… High-income households hold the majority of debt. The top income quintile held almost 50 per cent of the stock of household debt in 2014. Almost a third of households held no debt, with the majority of these being retired households.
Over the four years to 2014, about 40 per cent of households increased their levels of nominal debt, while a similar share of households reduced their holdings of debt (Graph 7). …

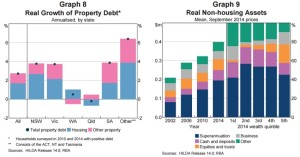
Property debt accounted for a little over 80 per cent of the stock of debt held by households in 2014. Average debt increased modestly from 2010 to 2014, by a little more than 2 per cent per year (Graph 8). …
graph89

Non-housing Assets
… The mean value of real non-housing assets increased from around $320,000 in 2010 to almost $400,000 in 2014 (Graph 9). … Wealthier households held a higher-than-average share of assets in the form of direct equity holdings and business assets, while households with lower net wealth held more in cash and deposits, superannuation and durable goods (Graph 9).

The mean superannuation balance grew by around 4 per cent per annum in real terms for all households over the period to $250,000 in 2014 (Graph 10). … The noticeably stronger growth in median superannuation assets relative to the mean for households aged 45 to 64 years suggests that the ‘typical’ (or median) household in these age groups are building up superannuation assets faster in the lead-up to retirement than the households in the same age group with the largest balances of superannuation (Graph 10).
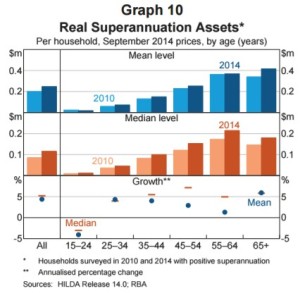
graph10

Conclusion
… The main driver of growth in household wealth over that period was an increase in the value of financial assets, mostly superannuation assets. Weaker growth in housing wealth, with declines in Queensland and Western Australia, contributed to the slower growth in total wealth from 2010–14. …

2. Conditions in the Manufacturing Sector | Sean Langcake(製造業界の現状)

[概要abstract]
Manufacturing output and employment have fallen steadily as a share of the Australian economy for the past three decades. This article looks at the composition of the sector and draws on the Reserve Bank’s liaison with manufacturers to provide an insight into some of their responses to the structural challenges in recent years. According to liaison, the increase in the supply of manufactured goods from low-cost sources abroad, exacerbated by the appreciation of the Australian dollar during the period of rising commodity prices, impaired the viability of many domestic manufacturers and precipitated the closure of some manufacturing production over the past decade. While the recent exchange rate depreciation has helped to improve competitiveness of Australian producers, so far there is only limited evidence of a recovery in manufacturing output and investment.
(オーストラリア経済において、製造業の生産と雇用は、過去三十年着実に低下してきている。ここでは、近年の経済構造の変化への製造業者の対応を洞察する。コモディティ価格上昇期に豪ドル高となったため、低コスト製品が海外から流入し、それがオーストラリア国内製造業者の価値を損ない、過去十年の製造業者閉鎖を促進した。最近の為替レート低下によりオーストラリア製造業者の競争力は改善されている一方、製造業者の生産と投資が回復してきている証拠はまだ限定的である。)

[補足・抜粋/excerpts]
Introduction
… It currently accounts for around 7 per cent of total output and employment. … over the 2000s, strong Asian demand for Australian commodities led to a sharp increase in the terms of trade and an appreciation of the Australian dollar. …

Manufacturing in Australia
Manufacturing output increased steadily throughout most of the 1990s before plateauing in the early 2000s; output today is around the same level it was just over a decade ago (Graph 1). … Over the past two decades, the Australian economy as a whole has grown considerably, resulting in a marked decline in manufacturing output as a share of total output. Employment in manufacturing has also declined over the past two decades, with growth in labour productivity in line with that of the economy as a whole. …
…investment in the manufacturing sector has also fallen steadily since its peak in 2005/06 (Graph 1). …
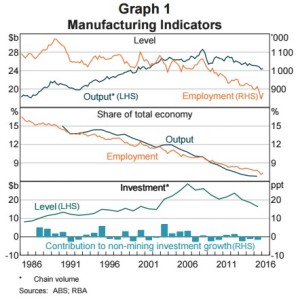
graph_1

Australia’s manufacturing sector is quite diverse and is comprised of several sub-industries, the largest being: food, beverage & tobacco; machinery & equipment; petroleum, coal & chemicals; and metal products (Graph 2). …
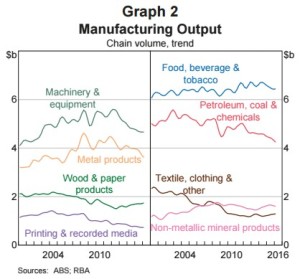
graph_2

The food, beverage & tobacco and metal products sub-industries both rely heavily on inputs from primary industries (agriculture and mining) where Australia has an abundant supply, and use a relatively low share of intermediate components that are imported. …
Conversely, the machinery & equipment and petroleum, coal & chemicals sub-industries use relatively few inputs from primary industries in Australia and have a relatively high share of imported intermediate components. …
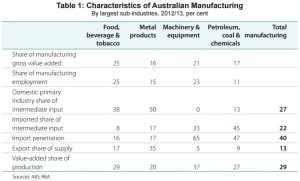
table_1

The International Context
Over the past 25 years, most advanced economies have seen their manufacturing sectors recede as a share of both output and employment, although Australia has generally had a lower share than many other advanced economies (Graph 3).
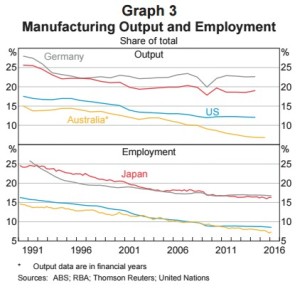
graph_3

The ratio of value added to total production in the Australian manufacturing sector is broadly comparable to that in other advanced economies’ manufacturing industries (Table 2). Relative to other Australian industries, manufacturing is a low value-added sector; the ratio of value-added to total production (29 per cent) is the lowest of any industry. …
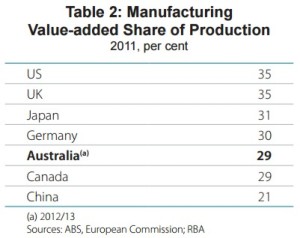
table_2

… The steady increase in China’s share of Australia’s merchandise imports has coincided with a fall in the prices of imported manufactured goods relative to domestic production (Graph 4).
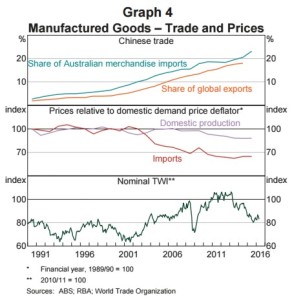
graph_4

The Australian Dollar and Implications for Competitiveness
The appreciation of the Australian dollar from 2000 to 2013 worked against the international competitiveness of Australian manufacturing (Graph 4). Exports of Australian manufactured goods grew slowly over this period as they became relatively more expensive overseas (Graph 5). …
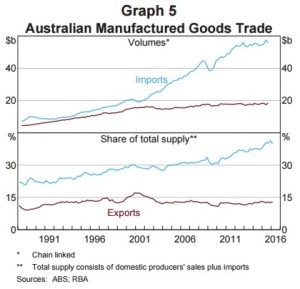
graph_5

… Typically, contacts maintain some productive capacity in Australia, either as a testing or research and development (R&D) facility, to protect their more sensitive intellectual property, or to be able to fill orders more quickly. Nevertheless, firms that have ‘offshored’ production typically have much less productive capacity remaining in Australia than their overseas operations. …
…there are significant lags between a depreciation of the dollar and a response in manufacturing production and exports due to the nature of supply chains. For instance, even though domestic producers have become more competitive against imported products, retailers or other manufacturers may have contracts that secure supply in advance, which inhibits their ability to switch to domestically produced products. …
…they responded to the appreciation of the dollar by importing more goods, either by choice or necessity as production of some inputs had moved offshore. … while the lower value of the dollar aids demand, margins are under pressure due to rising import costs in instances where local substitutes are not readily available.

Domestic Input Costs and Implications for International Competitiveness
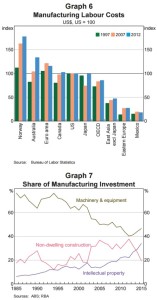
… Australian manufacturing labour costs appear to be relatively high compared with those in other economies – a feature that has become more pronounced over time (Graph 6). …
graph_67

…firms have been looking to find labour productivity gains by automating some production processes. They have also been developing new products to diversify their offering. These shifts are borne out in the nature of firms’ investments; increasingly, manufacturers are investing in intellectual property rather than physical capital (Graph 7). …

…foreign-owned manufacturing firms operating in Australia are more willing to invest in R&D than physical capital in their Australian subsidiaries, although it is difficult to quantify what share of manufacturing activity is accounted for by these firms. …

Difficulties Integrating in Supply Chains
…other economies have responded to pressure from cheaper, imported manufactured goods by integrating themselves more effectively into increasingly fragmented global supply chains. … Australia’s geographic isolation contributes to high trade costs and presents a significant impediment to greater participation in global supply chains. …the costs of trading Australia’s manufactured goods – largely international transport costs – are in the order of 20–25 per cent higher than the global average. … only 4 per cent of manufacturing firms are part of an integrated supply chain.
…Australia’s relatively high trade costs leave domestic producers primarily exposed to the relatively small domestic market and unable to benefit from the scale advantages that other advanced economies achieve through production for larger domestic markets and export markets. …around 45 per cent of the difference between US and Australian non-farm labour productivity levels can be explained by Australia’s geographic isolation. High trade costs may also protect less productive domestic firms from import competition, although this protection is likely to have been eroded through time by lower international search and transaction costs. …

Conclusion( )内は抄訳
The depreciation of the Australian dollar over recent years has helped to improve the competitiveness of Australian manufacturing. Additionally, there is likely to be a steady level of activity in the food, beverages & tobacco sub-industry due to Australia’s comparative advantage in primary resources and growing export demand. Against this, softer demand from the mining sector and the cessation of passenger vehicle production will weigh on output, although motor vehicle and transport equipment production currently makes up only around 5 per cent of manufacturing output.
(豪ドル安は製造業の競争力を向上させてきた。食品飲料煙草が伸びた反面、鉱業の鈍い伸びや乗客用乗物の製造中止は今後製造に重くのし掛かるであろう。)
In the longer term, the structural challenges facing the Australian manufacturing sector are likely to constrain output. Declining global prices for manufactured goods and the sustained high level of the Australian dollar during the resource investment boom impaired the viability of many Australian manufacturers and precipitated considerable structural change in the sector, with numerous manufacturers either closing or shifting production to lower-cost economies. R&D operations are one area where Australia’s cost disadvantages are less of an impediment and our highly skilled workforce is a comparative advantage. Although R&D investment has been growing steadily, the subsequent demand for labour and, in particular, physical capital are likely to be less than was generated by ‘traditional’ manufacturing activities.
(長期的には、オーストラリア製造業の構造的課題は製造を抑える。製造業の製品の世界的な価格低下と、資源ブームの間高止まりした豪ドルは、オーストラリアの多くの製造業者の生命力を削ぎ、廃業か低コスト国での生産へのシフトにより製造業界の構造変化を早めた。R&Dはオーストラリアのコスト面での不利がさほど問題にならない分野であり、熟練度の高い労働力が比較優位となっている。R&Dへの投資の伸びは堅調であるが、R&Dにおける引き続く労働力の需要ととりわけ物的資本の需要は’伝統的’製造業における需要よりは少なそうである。)

Crisis Management 危機管理 Vol.1

(All the below links are in English.)

9月1日は、日本では防災の日(参考 Preparing for Disaster a Part of Japanese Life | Richard Medhurst @nippon_en)です。防災・危機管理の訓練を各組織で行うのが通例です。地球気候変動による自然災害の増加に加え、事故や事件が減ることも無い上、国際情勢の流動性・連動性により国家安全保障事案も増え、ますます平時より不測の事態に備えるしかありません。

企業など組織においては、職員の生命・財産の安全の確保はもちろんですが、組織の業務や財産の維持、組織風評等に係る対応などにも気を抜けません。加えて、災害・事故・事件とは別で、生命・財産には関係しないが社会的には要対応という案件も存在し、対応自体は感覚的に危機管理に近いものとなります。

今後、折に触れて書きますが、まずはご参考まで、ここ最近の英文記事を以下挙げておきます。

Japan 日本
Olympic task: Tokyo is already in crisis management mode for 2020 Games (Sep 1) | Justin McCurry @EYnews @guardian
With four years to go, Tokyo wants to ensure its Olympic Games will be protected against both cyber-attacks and earthquakes
~ Preparing for natural disasters
~ The threat from cyberspace
~ Towards sustainability

Natural disasters 自然災害
Five Key Points from the 2016 World Risk Report (Aug 26) | Caitlin Werrell & Francesco Femia; @CntrClimSec @UNUEHS
~ Fact 1: Disasters and disaster risk are on the rise worldwide
~ Fact 2: There is no such thing as a natural disaster
~ Fact 3: Infrastructure is a key risk factor
~ Fact 4: Infrastructure alone is not enough, it must also be maintained and managed correctly
~ Fact 5: Southeast Asia, Central America, Oceania and the Southern Sahel are consistently disaster risk hotspots

National security 国家安全保障
Vietnamese president says there will be no winners if countries war over South China Sea: Tran Dai Quang said the “recent worrying developments” in the disputed waters is threatening regional security. (Aug30) | Nandini Krishnamoorthy ‏@IBTimes @AssociatedRisks

Violence 銃事件
American University attack: at least 12 dead and 44 injured in Afghanistan- Students in Kabul were trapped in classrooms amid explosions and automatic gunfire as militants attacked the university (Aug 25) | Sune Engel Rasmussen @guardian @ScholarsAtRisk

Terrorism テロリズム
Terrorism and political violence guide (Aug 16) | @StrategicRISK

Oil production エネルギー安全保障
3 reasons why an OPEC production cap is still unlikely (Aug 14) | Jon Lang @risk_insights

Economic stability 経済の安定
economic rebalancing and reforming the IMF: The former Bank of England governor discusses Brexit, radical regulatory reform, the difficulties rebalancing the European and global economies and an overhaul of the International Monetary Fund (Aug 24) | Christopher Jeffery @CentralBanking_ @RiskDotNet

Cables 通信回線の物理的脆弱性
Severed Communications: Businesses face risks from undersea data cable vulnerabilities. (Aug 3) | Jonathan McGoran @RiskInsurance

Cyber サイバー攻撃
Incidents in 2015 proved that executives need to get familiar with cyber-risk. Find out your company’s risk level (Feb 4) | Rob Sloan @DJCompliance @InfosecurityMag

Earthquakes 地震
Small Villages Hit Hardest by Italian Earthquake (Aug 24) | Caroline McDonald‏ @RiskMgmt

Flood 洪水
3 strategies for recovering from flood losses (Aug 22) | ROBERT W. O’BRIEN @PC_360 @RiskStrategies

Climate change 気候変動
Cities and climate change – the funding gap (Aug 26) | Cecilia Reyes @Zurich

Compliance コンプライアンス
Why Walmart’s Chemicals Disclosure Is a Smart Business Move (Jul 22) | Jessica Lyons Hardcastle @ELDaily @ComplianceRisks

Compliance コンプライアンス
Enterprise compliance retail companies: Changing requirements – Prepare for what’s around the corner | @DeloitteRisks

Ireland アイルランド Vol.4

アイルランド中央銀行の2016年第1四半期レポート Quarterly Financial Accounts Q1 2016 (18 August 2016): Irish households become the fourth most indebted in Europe | @centralbank_ie 概要・抜粋(abstract/excerpts) です。

[概要abstract]
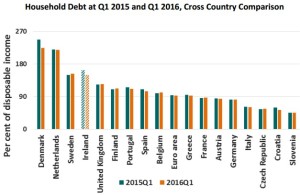
1. Irish households fell from being the third most indebted in the European Union to the fourth most indebted during Q1 2016. This was largely due to the continued reduction in Irish household debt, as well as, further increases in Irish disposable income.
(アイルランド国民の家計は、2016年第1四半期には、EU加盟国中借金が多い3番目から4番目へとなった。可処分所得が一層増えたことと、家計負債が引き続き減ったことが大きい。)
2.Household debt as a proportion of disposable income now stands at 149.4 per cent. That is its lowest level since end-2004.
(可処分所得に対する家計負債は、今、149.4%である。2004年末以来の最低レベルである。)
3. Households net worth increased by 0.3 per cent to reach €628.7bn, or €132,141 per capita. The increase in net worth was largely driven by a rise in housing asset values (€1.7bn), as well as a further decline in household liabilities (€0.9bn).
(家計の純資産は、0.3%増の6287億ユーロ、国民一人あたり132141ユーロに達した。家計負債の更なる9億ドルの減少と、住宅財産価値の17億ドルの上昇による。)
4. NFC debt to GDP declined by 9.8 percentage point over the quarter, falling to €257.3bn. Irish NFC debt has been extremely volatile in recent quarters due to the impact of domiciled MNCs on debt and GDP.
(non-financial corporations 非金融法人の総負債は第1四半期に2573億ユーロとなり、対GDP比率は9.8%減った。アイルランド国内に本社を置く multinational corporations 多国籍企業が総負債やGDPへの影響を持つため、最近のいくつかの四半期において非金融法人の総負債は極端に揺れ動いている。)
Household Debt Cross Country Comparison

[補足・抜粋excerpts]
1. Net Lending/Borrowing of All Sectors (Chart 1.1 関連)
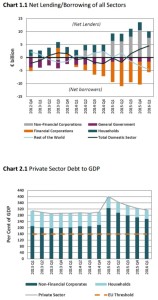
The domestic economy continued to be a net lender to the rest of the world during Q1 2016, as the net borrowing of government and financial corporations was exceeded by deleveraging by households and non-financial corporations…

Net LendingBorrowing Private Sector Debt to GDP

2. Private Sector Debt (Chart 2.1 関連)
… CSO revisions to the National Accounts and International Investment Position… redomiciling of some corporations and corporate restructuring… contributed to significant increases in GDP and NFC debt from 2014 onwards. Private sector debt as a percentage of GDP peaked in Q1 2015 at 400.7 per cent, and has since declined substantially to 315.2 per cent in Q1 2016. … primarily by growth in annualised GDP over the period, but is also reflective of falling private sector debt, which has contracted by 3.7 per cent since Q1 2015. …

3. Household Sector
Household Net Worth Debt Indicators

Chart 3.1 関連
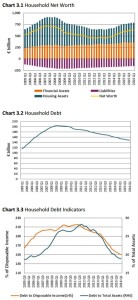
… This was partially offset by a decline in households’ holdings of financial assets (€0.5bm). Compared to a post-crisis low of €454.1bn in Q2 2012, household net worth has risen by 38.5 per cent. However, it is still 12.4 per cent lower than its pre-crisis peak of €718bn in Q2 2007.

Chart 3.2 関連
Household debt continued to decrease during Q1 2016, falling by €1.1bn, or 0.7 per cent, to €148.5bn. This represented a household debt per capita of €31,216. Household debt is at its lowest level since Q1 2006. …

Chart 3.3 関連
Indicators of household debt sustainability continued to improve during Q1 2016. Debt as a proportion of disposable income fell over the quarter, from 152.7 per cent to 149.4 per cent, reflecting both the decline in household debt, as well as strong growth in annualised disposable income. …

Comparison Transactions in Financial Assets Deposit Transactions with MFIsGovernment

Chart 3.4 関連
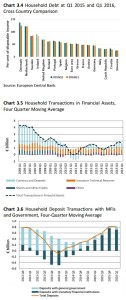
… Over the year Danish household debt fell significantly more than any other country examined, declining by 23.2 percentage points. In contrast to this, Swedish households saw a 4 percentage point increase over the same period as they climbed to become the third most indebted in the European Union, with a household debt level of 153.5 per cent of disposable income.

Chart 3.5 関連
… The reduction in financial assets over the quarter largely reflected a fall in transactions of insurance technical reserves. … The majority of households’ financial investments over the quarter were in the form of currency & deposits, while shares & other equity experienced positive transactions for the first time since Q4 2013.

Chart 3.6 関連
… This marked the first time since Q4 2013 that household deposit transactions with MFIs (monetary financial institutions) had declined. In contrast, households increased lodgements with government deposit accounts for the first time since Q1 2013.

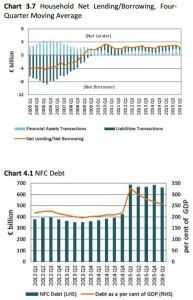
Chart 3.7 関連
… Over recent quarters net lending has become increasingly driven by higher investment in financial assets, as opposed to deleveraging.

Household Net LendingBorrowing NFC Debt

4. Non-Financial Corporation Sector
Irish NFCs are significantly impacted by the activities of large MNCs. These latest NFC results incorporate the recent annual revisions to the CSO’s International Investment Position (IIP). The revisions include large MNCs which redomiciled to Ireland or moved significant parts of their balance sheets to Ireland during 2014 and 2015. These entities also contributed towards some of the very substantial increase in Irish GDP for 2015.

Chart 4.1 関連
… The decline in debt over the past year largely reflected exchange rate movements. Debt as a percentage of GDP fell from 327.5 per cent in Q1 2015 to 257.3 per cent in Q1 2016. This reflected both falling NFC debt, as well as, substantial GDP growth during 2015.

NFC Debt Comparison Loans AssetsLiabilities

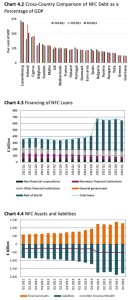
Chart 4.2 関連
… Luxembourg, which also has a lot of large MNCs relative to the size of its economy, had the highest debt at 349 per cent of GDP. … how volatile Irish NFC debt to GDP has been in recent years compared to other euro area countries.

Chart 4.3 関連
… The substantial increase in debt held by non-residents reflects this corporate activity and explains why exchange rate movements have had a significant impact on NFC debt in some quarters. …debt held by Irish residents has been on a downward trend in recent years. …partly reflected NFC deleveraging with Irish MFIs.

Chart 4.4 関連
…largely reflected MNC activities. Net financial assets (financial assets minus liabilities) became even more negative since Q1 2015. This is because some MNCs had large non-financial assets or relocated substantial non-financial assets to Ireland.

“The Creation and Destruction of Value” 価値の創造と破壊 Vol.9

(All the below links are in English.)

Vol.9 金融革命の度合と限界(第4章-2)

 第二の技術革新は、証券が更なる証券の発行によって保証されていることである。一つの債権を細分化する過程で、債務不履行のリスクは債権の他の性質から切り離されるため、理論的には全ての証券が債務不履行しない形即ちリスク無しで購入されることとなる。また、保証人が新たな保証契約を通じてリスクを転嫁することもできるので、債務不履行の際に損害を被る可能性も低い。
 J.P.モルガンが1995年に始めたもう一つの技術革新であるCDS(Credit Default Swap)は、2008年には58兆ドルに達し、世界GDP合計の50兆ドルを抜いていた。非常に小さいリスクと頼りになる手数料のために、AIGインターナショナルやSwiss Reのような大手かつ多角経営の保険会社がこのような保証契約に魅力を感じ取り組んでいた。リスクに対応するために金融当局が定めた自己資本規制比率も結局無駄になった。2003年からの5年間で米欧の10大銀行は資産を倍増し15兆ユーロに達したが、リスク調整資産は5兆ユーロに達したにすぎなかった。

参考
Credit Derivatives Handbook (PDF) | J.P. Morgan
The Value of Risk: Swiss Re and the History of Reinsurance | Peter Borscheid, Harold James, David Gugerli, Tobias Straumann
Global Financial Stability Report, April 2008 | International Monetary Fund

ツイッター paper.li Vol.4

All the below links are in English.

弊社ツイッターアカウントの一つ @WSjp_insight のRTによる paper.li 掲載記事7件を貼っておきます。

Irish economic growth | @RTEbusiness

Ireland’s national accounts | @ucddublin @Aidan_Regan

Soon Your Smart Car Will Also Be an Amazon Locker | @BloombergCA @ElisBehrmann @rweiss5

2016 @BSAnews GLOBAL CLOUD COMPUTING SCORECARD (pdf) | @invest_canada

IMF Backs More BOJ Easing If Coupled With Comprehensive Reforms | @business @RichMiller28

Nagasaki, 1945: “The world did not need your experiment” | @jricole

Rio 2016: What Olympic sports taught 8 leaders about successfully running a business | @Inc @JustinJBariso

“The Creation and Destruction of Value” 価値の創造と破壊 Vol.8

(All the below links are in English.)

Vol.8 金融革命の度合と限界(第4章-1)

 証券化に係る最も最近の根本的な技術革新は、1990年代半ばに始まり、J.P.モルガンが関係している。決定的だったのは、1997年に着手された Broad Index Securitized Trust Offering (BISTRO) であった。この制度では、元々の債権関係が細分化され、簿外単位で証券化され、Structured Investment Vehicle (SIV) として取引された。21世紀に入ると、証券化は不動産ビジネスの形を変え始めた。サブプライム・モーゲージは、認証後に債権に何が起こっても認証者が責任を負わないものであった。
 2005-07年には、5400億ドルの抵当化債務及び不動産証券が創り出された。2009年初期までにはこれらの内1020億ドルが整理され、優先債の32%、メザニン債の5%しか回収されなかったことになる。ジョージ・ソロス曰く、合理的期待形成モデルへの過度な思い入れについては、経済学者は投資銀行員と同様に責任があり、その間違いの代償を払うべきである。

参考
Robert Lucas, rational expectations, and the understanding of business cycles | @LarsPSyll
LIFE AFTER “RATIONAL EXPECTATIONS”?: Imperfect Knowledge, Behavioral Insights and the Social Context [PDF] | Roman Frydman and Michael D. Goldberg
The New Paradigm for Financial Markets: The Credit Crisis of 2008 and What It Means [PDF] | George Soros

“The Creation and Destruction of Value” 価値の創造と破壊 Vol.7

(All the below links are in English.)

Vol.7 2008年世界金融危機(第3章-3)

 第三に人の流れの減少の面である。
 2008-09年の急速な貿易の収縮においては、グローバルな相互の繋がりを縮小させることが政策として選択されたのでは決してなかったが、外国人の求職に反対する国民が英独では過半数を超えるなど国民感情の転換はあった。
 また、2008年には自国に移民が押し寄せ労働市場が崩壊し得るグローバリゼーションの時代になっており、新興国が自国のみで破綻していた1990年代よりも先進国の不安は遥かに大きく、先進国は新興国にカネ・モノ・労働力の市場において徹底した対策を要求していたが本来効果のある対策も徐々に効果的でなくなった。

(あくまで参考:The Rise and Fall of Pyramid Schemes in Albania | Christopher JervisThe Free Movement of Workers in an Enlarged European Union: Institutional Underpinnings of Economic Adjustment | IZAFact Sheets on the European Union | European Parliament