All the below links are in English.
以下弊社ページ(全て英語)は、標記につき取り急ぎ関係記事の一部を抜粋したものです。
各回、複数の分類に入り得る記事があります。
今後も、原則として、弊社英語サイトにて動向を追う等して参ります。
英語圏政治経済情報
All the below links are in English.
以下弊社ページ(全て英語)は、標記につき取り急ぎ関係記事の一部を抜粋したものです。
各回、複数の分類に入り得る記事があります。
今後も、原則として、弊社英語サイトにて動向を追う等して参ります。
(All the below links are in English.)
Vol.13 パワーポリティクスの重要性(第5章-3)
経常海外収支の考え方には二つのアプローチがある。第一に、貯蓄と投資のレベルの所産である。貯蓄余剰が経常海外余剰を産み、貯蓄と投資の差額の輸出をもたらす。貯蓄のマイナスは海外からの資本流入で補われる。第二に、投資収入からモノ・サービスへの純支払額を引くという考え方である。
米国の投資勘定は、長期間の経済政策の転移を示している。1946年には、米国の為替勘定はGDP比3.9%に相当する黒字を計上し、貿易収支は67億ドルの黒字、サービス貿易収支は10億ドルの黒字を計上した。その後の30年間、米国は、全世界に投資を続け、また、西欧と日本の地域経済の構造を変えた。その結果、固定為替制いわゆるブレトンウッズ体制が崩壊した1971年には、総累積で、米国の為替勘定はGDP比0.1%に相当する赤字を計上し、貿易収支は23億ドルの赤字、サービス貿易収支は少し黒字、投資勘定収支は73億ドルの黒字を計上した。更に1985年には、巨大財政赤字と緊縮通貨政策の下で急激な米ドル高となり、為替勘定でGDP比2.8%・1182億ドルの赤字、投資勘定収支は257億ドルの黒字を計上した。借り入れブーム最終期の21世紀初頭には、米国は、政府が拠出しているファニーメイやフレディマックのモーゲージ債への資本流入を大量に得ており、2008年には中国やロシアなどの外国人による購入は累積で1兆3000億ドルを計上した。
あくまで参考
The Current Acccount vs the Trade Deficit | @gregmankiwblog
Current Account Deficits: Is There a Problem? | Atish Ghosh & Uma Ramakrishnan @IMFNews
Financial Globalization and the U.S. Current Account Deficit (PDF) | Matthew Higgins & Thomas Klitgaard @NewYorkFed
The Role of Savings and Investment in Balancing the Current Account: Some Empirical Evidence from the United States (PDF) | Giovanni P. Olivei @BostonFed
Foreign Bondholders – and not the U.S. Mortgage Market – Drove the Fannie/Freddie Bailout | WILLIAM PATALON III @moneymorning
Russia’s Financial Crisis: Economic Setbacks and Policy Responses | @SIPA
Excerpt: Weak yen is Japan’s best bet for growth (January 5, 2015) | Prof David Weinstein (@columbia_econ) @NAR(English)
This is a tough time to be a proponent of tax increases in Japan. In 1997, after a very successful fiscal stimulus, Japan raised taxes, and the economy was thrown into a major recession. In April 2014, Japan raised taxes again and converted a weak recovery into a serious recession.
Surprisingly, some people called for yet another tax increase, but, wisely, Prime Minister Shinzo Abe chose to postpone that decision. To those who criticize him for being inconsistent, Abe could easily employ John Maynard Keynes’ famous retort: “When I find new information, I change my mind; what do you do?”
… two questions remain unanswered: Why is it that Japanese tax increases are associated with such negative economic performance, and how is Abenomics going to pull Japan out of a seemingly inevitable fiscal crisis? …
First, on the fiscal level, I have long argued that we need to work with the right numbers. On the face of it, the problem looks terrifying. The flow of funds data reveals that Japan’s gross government debt stands at 1.177 quadrillion yen ($9.79 trillion), or about 243% of gross domestic product. That number isn’t very useful for understanding the problem for two reasons.
〔cf. https://www.mof.go.jp/tax_policy/summary/condition/007.htm〕
– First, the Japanese government holds many of the Japanese government bonds that it issues, so there is substantial double counting of liabilities. Just as one should value a company by looking at its net worth, only a government’s net debt (debt minus assets) is an economically meaningful concept of its current fiscal situation.
– Second, the assets and liabilities of Japan’s public corporations should be included in the overall consolidated government balance sheet, just as a company’s subsidiaries should be included in its consolidated balance sheet. When we calculate the consolidated balance sheet for the government, we find that total government net debt stood at 132% of GDP in June of 2014. *People who pay attention to these figures will note that this number is about 20 percentage points lower than the net debt number reported by the International Monetary Fund. The reason is that most countries don’t report as detailed flow of funds data, so the IMF is forced to rely on narrower, and less accurate, information in order to make international comparisons with less-developed countries. However, because Japan does collect good data, it makes sense to use it and discuss the issue with the right information.
… Since the central bank could, in principle, forever hold its current stock of JGBs, the government need not worry about how it is going to repay these bonds. If we consolidate the BOJ’s balance sheet with that of the government, we find that the net liabilities of the government stood at only 80% of GDP in June of 2014: one-third the gross-debt number.
In other words, the government has a lot of assets to cover its liabilities, so in the event of a crisis, it wouldn’t need to finance anything close to the official gross or net debt numbers. This doesn’t mean there can’t be a crisis. …
As these numbers make clear, Japan’s problem is not the current level of debt but the future path of government expenditures. Certainly, many have claimed that Japan has shifted toward a path of debt growth that is not sustainable.
… Back in 2004, @christianbroda3 (@NYFedResearch) and I wrote a paper, “Happy News from the Dismal Science: Reassessing Japanese Fiscal Policy and Sustainability,” in which we forecast what Japanese government net liabilities would be in 2015 if the country’s fiscal policy was sustainable. We forecast that the net liabilities in 2015 would be 84% of GDP, which is right on track given the 80% number for June 2014.
… Some, like promoting women’s advancement opportunities, loosening immigration restrictions, and pushing forward with trade liberalization are likely to raise incomes in the long run. However, the effectiveness of these reforms is measured in years, if not decades. This doesn’t mean they shouldn’t be done — about 20% of U.S. productivity growth can be attributed to the country’s progress in reducing gender and racial inequality — but …
If structural reform is unlikely to produce changes in the near term and fiscal policy is likely to remain restrained, we need to think about whether monetary policy can actually boost Japanese growth. Here, I remain optimistic. …
Historically, we’ve seen that large devaluations are one of the most effective means of ending deflationary episodes. Indeed, many of the problems of Southern Europe would go away if only those countries could devalue their currencies. …
(All the below links are in English.)
Vol.12 パワーポリティクスの重要性(第5章-2)
グローバリゼーションへの挑戦はまた、グローバルな統合と国家のパワーとの関係についての古い議論が再度蒸し返されることも意味する。特に、グローバリゼーションの多くの批判者は、グローバリゼーションは国民国家のパワーを蝕んでいる、民主的に選出された政府は国際的に動く資本や思想・モノ・サービス・人の大規模な流れに直面して段々無力になって行く、と心配していた。
金融グローバリゼーションが挫折したので、今、皆、国が国民を残虐な外国の力から守るよう期待し、国もこの求めを実行しようと活動的に、むしろ過度に活動的になってきた。EUでは、銀行は単一の資本・マネーの市場で国の境界を跨いで活動していたが、規制監督は各国単位のままであったので、国の境界を跨ぐ複合的な銀行を解きほぐすには確たる能力を持たなかった。
あくまで参考
The future of banking in Europe: regulation, supervision, and a changing competitive landscape (PDF) | @EY
Adjusting to new realities – banking regulation and supervision in Europe | Danièle Nouy @ECB
Financial crisis: Where does Europe stand? – Regulation and supervisory architecture: Is the EU on the right path? | Lorenzo Bini Smaghi @ECB
David Marsh on the euro’s future: We can’t go on like this (interview video) | @Economist
Here are articles including those concerning the 3rd presidential debate. All the below links are in English.
You can check out the following website for policies: worldsolutions.work
標記第3回(於:@UNLV)などに関する記事を取り急ぎ以下貼っておきます。政策については上記URLをご覧ください。(本投稿一番下に私見を書きました。)
Linguist Geoffrey Nunberg on election language (YouTube) | UC Berkeley School of Information
Post-debate poll: Clinton 49%, Trump 39% (w PDF) | YouGovUS
White House Watch: Down to the Wire? | Rasmussen Reports
How Does the U.S. Stock Market Perform in Election Years? | JEFF DESJARDINS, Visual Capitalist
Presidential Debate: What you missed | Alexander Burns & Matt Flegenheimer, New York Times
Final Presidential Debate: Live Analysis of Clinton vs. Trump | Wall Street Journal
Most Memorable Lines of the 3rd Presidential Debate | ADAM KELSEY, ABC news
Watch: Trump Won’t Commit To Accepting Election Results In Final Debate | JESSICA TAYLOR, NPR
What Went Down In The Third Presidential Debate | FiveThirtyEight
Donald Trump and America’s Incomplete Contract with Itself | Mark Harrison, University of Warwick
Is America collapsing like the Roman Empire? | Barry Strauss, Fox news, CornellCAS
The Axe Files (Podcast): Ep. 88 – Ron Brownstein | David Axelrod, CNN, UChicago Politics
Clinton maintains double-digit (51% vs. 36%) lead over Trump | PRRI/Brookings Survey
Clinton’s Florida Lead Continues to Grow | PublicPolicyPolling
WashU Expert: Losing hurts in partisan politics | Erika Ebsworth-Goold
Covering Immigration and the Election (YouTube) | Stanford CCSRE
Marcus Noland commentary: Trade war would yield Ohio casualties | The Columbus Dispatch, PIIE
The Russian Group Hacking US Elections | Sheera Frenkel, Buzzfeed
THE THIRD PRESIDENTIAL DEBATE: LIVE-DRAWING BY JASON ADAM KATZENSTEIN | The New Yorker
The definitive ranking of presidential (and VP) debate moderators | Carly Mallenbaum, USA Today
A PARLIAMENT OF ELECTION EXPERTS | MICHAEL HARDY, Rice Magazine, Baker Institute
Expert: Rigging the presidential election would be “impossible” | Bailey Harbit, WSAW
私見:10月4日の副大統領候補者テレビ討論会の後、10月7日にトランプ候補の10年以上前の問題発言が公になったのが、大きな分かれ目でしょう。
政治ですから、この時期に公になり火が付いたのは不可思議ということもありません。また、白人既婚女性が対象となるなど限界を超えた感があり、テフロン加工が剥がれたようです。さらに、初の選挙出馬で公職経験も無い挑戦者という立場は、年齢が高くてもフレッシュさは満点で期待を集めますが、強い信頼関係の下で助けてくれる人材が不足し、それを自分の口一つでカバーするというのも限界があります。しかも、その舞台がアメリカ大統領選挙本選という世界最大の選挙ですから、無理なのかもしれません。それでも、既存政治家への不満や不信が国民に渦巻いているとは言え、共和党という二大政党の大統領選挙の予備選挙を勝ち抜いただけでも凄いことではあります。
討論会だけを見ると、多くの勝者投票結果などと異なるかもしれませんが、10月9日の2回目は超逆境ながら何とかやりすごすタフさを見せましたが、1回目は口数も悪態ももう少し大人しくして政策批判や政策主張の中で挑戦者らしく内容や根拠にもっと具体的に踏み込むのが良かったであろうし、3回目の今回は全てに一番新味に欠け全然魅力ある政権を想像させませんでした。他方、クリントン候補は、1回目の特に冒頭は疲れか緊張感があるようにも感じられましたし、2回目も決して楽な感じを受けませんでしたが、相手や場に慣れてくると徐々に底力が出てきたのか、3回目の今回は現職大統領のように全てに強く見えました。
選挙ですから、最後まで予断を許しません。投票により選ばれた大統領が、アメリカ国民に喜ばれつつ日本との一層の関係深化へも進み、両国の共存共栄が深まる、そんな方であることを祈念しております。
All the below links are in English. Excerpts are on our own.
PROBLEMS UNSOLVED AND A NATION DIVIDED (PDF; September 2016) | @MichaelEPorter, Jan W. Rivkin, @desaimihira, with Manjari Raman – The State of U.S. Competitiveness 2016 Including findings from @HarvardHBS’s 2016 surveys on U.S. competitiveness
抜粋・抄訳です。
EXECUTIVE SUMMARY p.2-5
Key Findings(主な調査結果)
[Chapter 1] The U.S. economy in an era of political paralysis
• Addressing America’s economic challenges requires a common understanding of competitiveness and the true underpinnings of prosperity. We define competitiveness as follows: A nation is competitive to the extent that firms operating there can compete successfully in domestic and international markets while also lifting the living standards of the average citizen. Competitiveness must lead to shared prosperity, in which all Americans have the opportunity to advance economically.
(アメリカの経済的課題に対処するには競争力についての理解を共有し繁栄の基盤を真に増強することが必要である。我々が定義する競争力とは、民間企業が一般市民の生活水準を引き上げつつ国内外の市場で競争に勝てることである。競争力は、全てのアメリカ国民が経済的に前進する機会を持つ、共有された繁栄につながるはずである。)
• U.S. competitiveness has been eroding since well before the Great Recession. America’s economic challenges are structural, not cyclical. The weak recovery reflects the erosion of competitiveness, as well as the inability to take the steps necessary to address growing U.S. weaknesses.
• Our failure to make progress reflects an unrealistic and ineffective national discourse on the reality of the challenges facing the U.S. economy and the steps needed to restore shared prosperity. Business has too often failed to play its part in recent decades, and a flawed U.S. political system has led to an absence of progress in government, especially in Washington.
[Chapter 2] Faltering U.S. economic performance
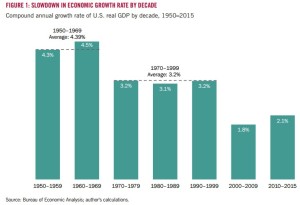
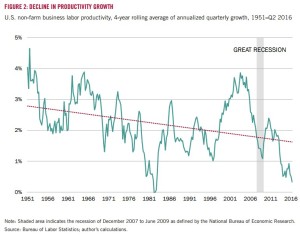
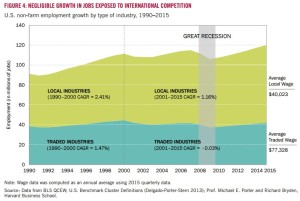
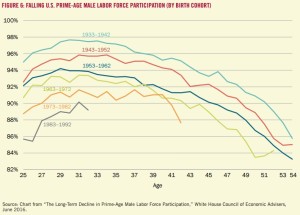
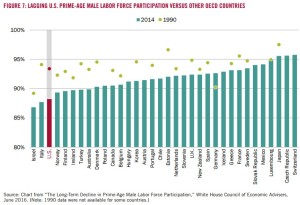
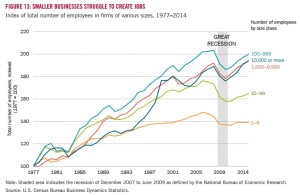
• America’s economic performance peaked in the late 1990s, and erosion in crucial economic indicators such as the rate of economic growth, productivity growth, job growth, and investment began well before the Great Recession.
• Workforce participation, the proportion of Americans in the productive workforce, peaked in 1997. With fewer working-age men and women in the workforce, per-capita income for the U.S. is reduced.
(生産的労働力の労働参加は1997年にピークを迎えた。…)
• Median real household income has declined since 1999, with incomes stagnating across virtually all income levels. Despite a welcome jump in 2015, median household income remains below the peak attained in 1999, 17 years ago. Moreover, stagnating income and limited job prospects have disproportionately affected lower-income and lower-skilled Americans, leading inequality to rise.
(実質家計所得の中央値は1999年以来下落し、事実上全ての所得レベルにおいて停滞し続けている。…)
• A similar divergence of performance has also occurred between large companies and small businesses. While large firms have been able to prosper, small companies are struggling, startups are lagging, and small business is no longer the leading job generator.
(… 大企業は繁盛することができたが、中小企業は苦労し、起業者は沈滞し、スモールビジネスはもはや雇用を産み出す牽引役ではなくなっている。)
• Overall prosperity is growing slowly, but the benefits are increasingly not flowing to middle- and lower-income Americans. This puts the American Dream, or the ability of any American to advance and prosper, at risk.
[Chapter 3] An eroding U.S. business environment
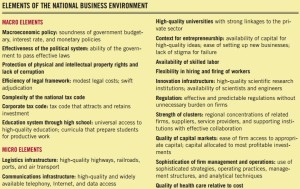
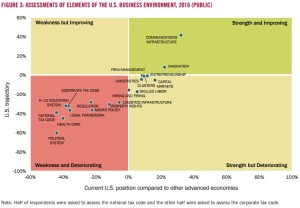
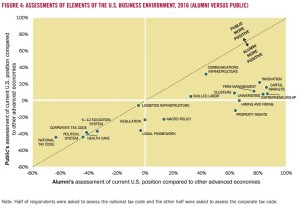
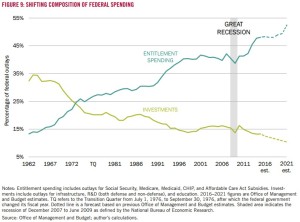
• The U.S. economy retains critical strengths. Business leaders (including HBS students) perceive strengths in areas such as higher education, entrepreneurship, communications infrastructure, innovation, capital markets, strong industry clusters, and sophisticated firm management. However, these strengths are being offset by weaknesses such as the corporate tax code, the K–12 education system, transportation infrastructure, the health care system, and the U.S. political system. Skills have also been eroding and becoming a weakness. Many of the greatest weaknesses are in areas driven by federal policy.
(アメリカ経済は決定的な強みを維持している。… しかし、…弱みに相殺されつつある。スキルも衰え弱みになってきた。多くの最大の弱みは、連邦政府の政策により運営されてきた分野のものである。)
• Alumni working in smaller firms have more negative views of the U.S. business environment than alumni working in larger firms. Members of the general public see the same U.S. competitive weaknesses as HBS alumni but, unlike alumni, perceive far fewer strengths.
• This pattern of strengths and weaknesses helps explain why the U.S. economy is no longer delivering shared prosperity. Large companies, the skilled individuals who run them, and those who invest in them benefit from America’s greatest strengths and are prospering. However, workers and small businesses are captives of the nation’s major weaknesses.
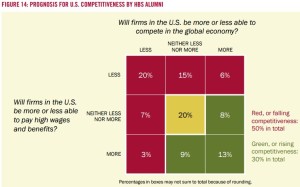
• Pessimism about the trajectory of U.S. competitiveness deepened in 2016, for the first time since we started surveying alumni in 2011. Fifty percent of the business leaders surveyed expect U.S. competitiveness to decline in the coming three years, while 30% foresee improvement and 20% see no change.
• Business leaders and the general public are particularly concerned about the future of American workers: respondents who expect lower pay and fewer employment opportunities for the average American in the future far outnumber those who expect improving worker outcomes.
• Inadequate investment in those parts of the business environment on which middle-class Americans depend (areas like K–12 education and skills), together with lack of policy improvement in areas on which small businesses depend (tax policy, regulations, infrastructure), have undermined overall productivity and shared prosperity.
[Chapter 4] The pressing need for a national economic strategy
• Given the significant challenges facing the American economy, the U.S. needs a national economic strategy more than at any other time in recent history. A strategy is an integrated set of priorities that builds on strengths while acknowledging and tackling weaknesses. It identifies the sequence of steps needed to best move ahead.
• The U.S. lacks an economic strategy, especially at the federal level. The implicit strategy has been to trust the Federal Reserve to solve our problems through monetary policy.
(アメリカには、経済政策、とりわけ連邦レベルのものが欠けている。暗示されている戦略は、連銀が金融政策によって問題を解決してくれるのを信頼することであった。)
• A national economic strategy for the U.S. will require action by business, state and local governments, and the federal government. All three levels have a crucial role to play in restoring competitiveness.
• Taking leadership in improving U.S. competitiveness is a pressing imperative for business leaders. Many companies have failed to invest enough in improving the business environments in the regions in which they operate. Companies can have a major impact on restoring U.S. competitiveness through internal steps such as training and improving opportunities and compensation for lower-income employees. Companies must also step up their role to enhance the business environment in their communities by investing in workforce skills, supporting public education, restoring a local supplier base, and participating in collaborative economic development programs in their regions. We find growing evidence that company attitudes toward investing in competitiveness are improving and this is a welcome development. There are more and more innovative programs underway by business in skills, education, and other areas critical to competitiveness.
(アメリカの競争力を回復させるのにリーダーシップを発揮することは、ビジネスリーダーにとって緊近の責務である。多くの会社は、自分達の事業分野におけるビジネス環境への投資を十分にできていない。会社は、低所得従業員への訓練や機会・手当の改善のような社内対策を通してアメリカの競争力を回復させるのに大きな影響力を持つことができる。…)
• State and local governments must also play a crucial role in improving the business environment, because many of the crucial drivers of competitiveness are local. States and cities need a clear strategy for competitiveness rather than isolated initiatives, and government leaders should foster cross-sector collaborations among local business leaders and other community stakeholders.
(競争力の決定的な推進者の多くは地域に根差しているので、州と市等政府もビジネス環境を改善するのに決定的な役割を担わなければならない。…)
• At the state and local level, the Project has found many examples of innovative steps to enhance competitiveness. Mayors, governors, nonprofit leaders, educators, and businesses are working together in new ways to build workforce skills, invigorate the local education system, upgrade infrastructure, improve the entrepreneurial ecosystem, and develop regional economic strategies. Cities and states across America are moving forward toward competitiveness, but more can be done and best practices need to be shared.
(… 市長、知事、非営利団体リーダー、教育者、ビジネスは、労働力のスキルを創り上げ、地域の教育システムを活気付け、起業的なエコシステムを改善し地方の経済戦略を策定する新しい手法において協働している。…)
[Chapter 5] An economic strategy for Washington
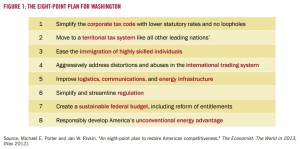
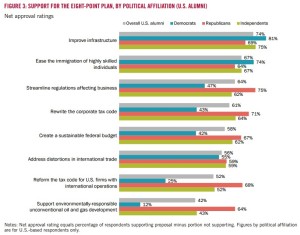
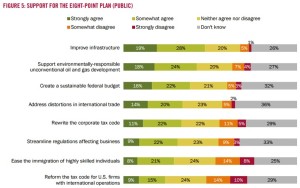
• Efforts by business and state and local government to restore competitiveness cannot deliver their full promise if the federal government does not act. Many of the major weaknesses facing the U.S. are in areas controlled by the federal government.
• In 2012, we put forward an Eight-Point Plan of federal policy priorities that would unlock U.S. economic growth and competitiveness. The Eight-Point Plan consists of the following policy recommendations: simplify the corporate tax code with lower statutory rates and no loopholes; move to a territorial tax system like all other leading nations’; ease the immigration of highly-skilled individuals; aggressively address distortions and abuses in the international trading system; improve logistics, communications, and energy infrastructure; simplify and streamline regulation; create a sustainable federal budget, including reform of entitlements; and responsibly develop America’s unconventional energy advantage.
(アメリカの経済成長や競争力の停滞を解き放つ連邦レベルの重点政策であるエイトポイント・プランを、我々は2012年に策定した。税率を下げ抜け穴もなくす法人税法の簡素化、他の主要国同様の源泉地国課税への移行、高度移住者の移入手続の簡素化、国際貿易における歪みや濫用への積極的な対処、物流・通信・エネルギーのインフラ拡充、規制の簡易化・合理化、福祉改革を含む持続可能な連邦政府予算の作成、アメリカのこれまでにないエネルギー優位を責任を持って創り出すこと、を提言している。)
• Each of these areas represents compelling U.S. weaknesses, primarily controlled by the federal government, that can have the most significant and near-term impact on the U.S. economy. There is also wide consensus on the policy change needed to make progress in each area. There are two other crucial U.S. weaknesses, public education and health care, but these are in fields controlled heavily at the state and local levels with no clear consensus yet on solutions.
(それぞれの分野は、アメリカの反論できないほどの弱みを表している。その弱みは、主に連邦政府に権限が握られているものであって、アメリカ経済にとって最も重要かつ近々に影響のあるものであった。また、各分野において進展させるための政策変更をしても構わないというコンセンサスがある。他に二つ、アメリカの決定的な弱みがあり、公共教育とヘルスケアである。しかし、これらは州と市等に大半の権限があるものであり、対処に係る明確なコンセンサスは無い。)
• Progress on even some of these eight priorities would transform the trajectory of the U.S. economy and the economic prospects of all Americans.
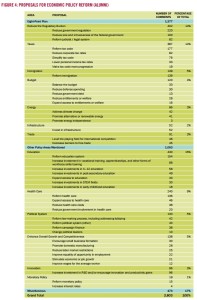
• A strong majority of HBS alumni and HBS students support all eight priorities, with consensus across all political affiliations. When asked in open-ended questions about which priorities alumni felt were most important for federal economic policy, alumni identify virtually the same priorities as those in the Eight-Point Plan. Alumni also mention education, health care, and the political system.
• In the general public survey, there was net positive support for seven of the eight priorities, with a tie on territorial taxes. Public support tended to be somewhat weaker, reflecting the fact that many in the public could neither agree nor disagree, or did not know, whether the eight priorities were good or bad for the economy. Divisive political rhetoric and an uninformed national debate have confused the average American about what the country needs to do to restore the economy. This confusion is a serious obstacle to America’s ability to make progress.
• Despite strong bipartisan support in business and net public support for the Eight-Point Plan, Washington has made very little or no progress on any of these federal economic priorities for well over a decade. The current presidential election is showing no signs of advancing a coherent plan to address these areas.
[Chapter 6] Achieving tax reform
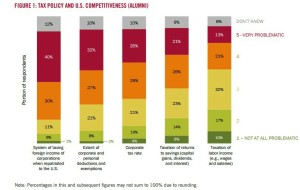
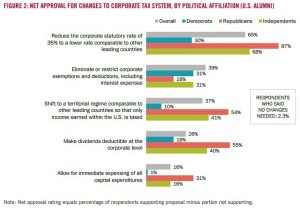
• We believe tax reform is the single area with the greatest potential for immediate impact on the economy and is long overdue given changes in the global economy. Corporate tax policy has become a key obstacle to U.S. competitiveness and economic growth, and reforming both corporate and personal taxation is essential to achieving a sustainable federal budget.
(税制が直ちに経済に最大の可能性をもたらす唯一の分野である、世界経済の変化の下で長年の懸案である、と我々は信じている。法人税政策は、アメリカの競争力及び経済成長に対する主な障害となっている。法人税制及び個人税制の改革は、持続的な連邦政府予算の実現にとって必須である。)
• Good tax policy should be guided by the goals of increasing economic efficiency, achieving greater equity, and reducing complexity. The forces of globalization have amplified the inefficiencies and complexities of the current tax system and demand that reform make the U.S. less of an outlier in key tax policy areas – particularly corporate tax policy. Efforts to reduce the negative effects of globalization should be focused on improving competitiveness, for instance, by upgrading the skills of workers threatened by offshoring, rather than on ill-targeted tax policies.
• The top corporate tax problems, according to the surveyed business leaders, are the high corporate tax rate and the taxation of international income. Business leaders report overwhelming and bipartisan support (over 95%) for corporate tax reform. Consensus corporate tax reforms include reducing the statutory rate by at least 10 percentage points, moving to a territorial tax regime, and limiting the tax-free treatment of pass-through entities for business income. The transition to a territorial regime should be complete, not half-hearted via the inclusion of an alternative minimum tax on foreign income. The feasibility of corporate tax reform is promising given the broad consensus on the nature of the problem and the required direction for reform.
(ビジネスリーダーへの調査結果によると、法人税制の一番の問題は、税率の高さと、国際的収入への課税である。法人税制改革には、圧倒的多数かつ超党派で(95%超)の支持が集まっている。法定税率を少なくとも10%下げること、源泉地国課税へと移行すること、パス・スルー法人の事業収入への免税措置を限定すること、などである。…)
• Comprehensive reform of personal taxes will be more challenging. There is less support for many types of personal tax reform. However, there is broad support for instituting a minimum tax on incomes above $1,000,000. Increasing the tax rate on savings; eliminating the deductibility of charitable giving, state and local taxes, and mortgage interest; and taxing employer-provided health insurance did not receive majority support. Respondents support limitations on deductions and exemptions in general but react strongly against them when specific examples are provided.
(個人税制の包括的改革は、もっと困難であろう。多種ある個人税制の改革には、法人税制へほどは支持が無い。しかし、100万ドル以上の所得には最低限の税を課すことには幅広い支持がある。預貯金への税率を上げること、慈善事業への寄付や州市等税さらには抵当金利への税控除を削減すること、雇用主による健康保険へ課税すること、は多数の支持を得なかった。回答者は、税控除や免除を制限することには総論賛成であったが、各論には強い反応があった。)
• Carbon, not consumption, taxes are the best step forward. Carbon taxes are remarkably popular both as a separate revenue raiser and as part of a structural, revenue-neutral reform. In contrast, consumption taxes are quite unpopular and elicit the most spirited commentary, positive and negative, from our alumni. Several recently-proposed new ideas also receive support, including taxing non-C corporation business income, raising the cap on income subject to the payroll tax, and allowing for the deductibility of dividends at the corporate level.
• HBS alumni also strongly support spending reductions as a means to fiscal stability. Nearly one-third chose not only reduced spending, but also reduced taxation. MBA students are much more accepting of tax increases and less supportive of spending cuts.
• To achieve the right kinds of tax reform, leaders must begin to speak more realistically about the fiscal realities America faces. In addition, simplistic, polarizing, and protectionist rhetoric must be avoided. The time for tax reform is long overdue.
• Tax reform can also contribute directly to shared prosperity. The earned income tax credit (EITC) is probably the single most important innovation on the personal tax side over the last two decades. Simplification and expansion of the EITC is a promising direction for reform.
[Chapter 7] A failing political system
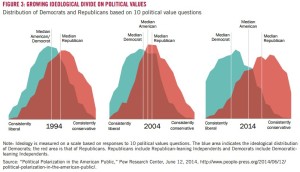
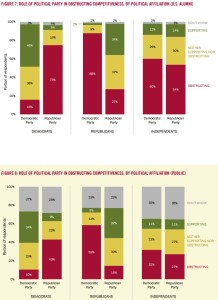
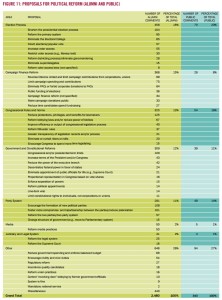
• The U.S. political system was once the envy of many nations. Over the last two decades, however, it has become our greatest liability. Americans no longer trust their political leaders, and political polarization has increased dramatically. Americans are increasingly frustrated with the U.S. political system. Independents now account for 42% of Americans, a greater percentage than that of either major party.
(アメリカの政治システムは、以前は多くの国からの羨望の的だった。しかし、過去二十年以上、アメリカ最大の負の財産となった。アメリカ人はもはや自分達の政治リーダーを信じず、政治の二極化は劇的に増大した。…)
• The political system is no longer delivering good results for the average American. Numerous indicators point to failure to compromise and deliver practical solutions to the nation’s problems. Political polarization has especially made it harder to build consensus on sensible economic policies that address key U.S. weaknesses. It is at the root of our inability to progress on the consensus Eight-Point Plan.
(政治システムは、もはや普通のアメリカ人には良い結果をもたらさない。無数の指標が示すとおり、妥協の失敗、国の問題への実際的な解決策を提供できていない失敗、がある。政治の二極化は、アメリカの主要な弱みに取り組む賢明な経済政策に係るコンセンサスを形成するのを特に難しくしている。…)
• A large majority of HBS alumni believe the political system is obstructing U.S. economic growth and competitiveness. Many alumni who self-identified as Democrat or Republican blame the other party, but a sizable proportion also hold their own party responsible.
(…政治システムがアメリカの経済成長や競争力を妨害している。…民主党員か共和党員かを自己表明していると他党を責めるが、大きな割合の者達が自党に責任があるとも考えている。)
• Among the general public, many believe that the political system is obstructing economic progress. However, many Americans are unsure, which we attribute to the divisive and partisan dialog on the economy which has confused the public on many issues.
• There is strong support for political reform among surveyed alumni. Of six common proposals for political system reform, a strong majority of HBS alumni support five. The most supported reforms are gerrymandering reform and campaign finance reform.
• Among the general public, the top two political reforms supported are term limits for the House and Senate and campaign finance reform. However, a large percentage of the general public are unsure about which reforms they favor.
• Overall, we believe that dysfunction in America’s political system is now the single most important challenge to U.S. economic progress. Many Americans are keenly aware that the system is broken, but are unsure why it is broken or how to fix it. While there is rising frustration with politics, there is, as yet, no framework for understanding the reasons for today’s poor performance and proposing effective solutions. Identifying such a framework, and the set of reforms that can change the trajectory of our political system, has become a crucial priority.
(… 政治システムが壊れている、と多くのアメリカ人が痛切に感じているが、何故壊れているかどうやって直せるかは分かっていない。政治への不満は高まっているが、今日の貧弱な成果の理由を理解し効果的な解決策を提案する仕組みは無い。…)
(All the below links are in English.)
Vol.11 パワーポリティクスの重要性(第5章-1)
危機は、民主主義か専制政治かの実行可能性についての態度のみならず、支配的な国際秩序への適応についての態度も、変えさせてしまう。例えば、金融危機は、経済的オープンさから被るビジネス上の利益と、孤立した国家的協調組合主義(政府の経済政策の決定や執行の過程に企業や労働組合を参加させるシステム)における集合的な合意を形成するのを好む者達の、その力の均衡をひっくり返すかもしれない。
あくまで参考
Neo-Liberal Small States and Economic Crisis: Lessons for Democratic Corporatism (PDF) | BALDUR THORHALLSSON @uni_iceland & RAINER KATTEL @rainerkattel @TallinnTech
The Political Economy of Social Pacts: ‘Competitive Corporatism’ and European Welfare Reform | MARTIN RHODES @OxUniPress
FROM NATIONAL CORPORATISM TO TRANSNATIONAL PLURALISM: EUROPEAN INTEREST POLITICS AND THE SINGLE MARKET (PDF) | Wolfgang Streeck @KelloggInst
All the below links are in English.
弊社ツイッターアカウントの一つ @WSjp_insight のRTによる paper.li 掲載記事4件を貼っておきます。
National raw materials agreement to foster circular economy by 2050 | @MinInfraEnvirNL
Rising Irish property prices threaten stability, @OECD warns | @IrishTimes @BRegsBlog
3 Unexpected Fish Species Found in the Inland Bays | @DEInlandBays
Sen. President Sweeney calls Christie’s tax deal nix with Pa. ‘horrible’ | @Trentonian
(All the below links are in English.)
Household Indebtedness and Financial Vulnerability (PDF, 19 January 2016) | @PBO_DPB 国民家計の負債と金銭的脆弱性 | カナダ連邦議会予算官(Parliamentary Budget Officer)本文抜粋・一部抄訳です。
Executive Summary 〔抜粋excerpts〕
…
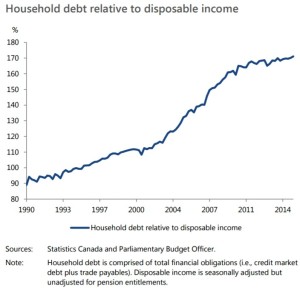
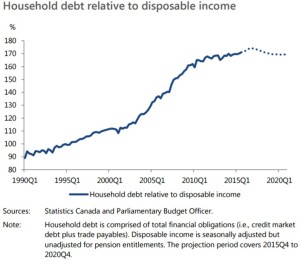
The indebtedness of Canadian households continues to trend higher. In the third quarter of 2015, total household debt (i.e., credit market debt plus trade payables) reached 171 per cent of disposable income. In other words, for every $100 of disposable income, households had debt obligations of $171. This is the highest level recorded since 1990.
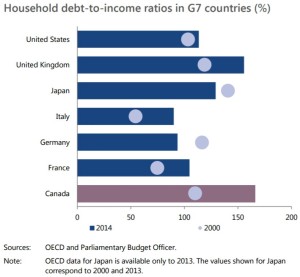
• Among G7 countries, Canada has experienced the largest increase in household debt relative to income since 2000. Households in Canada have become more indebted than any other G7 country over recent history.
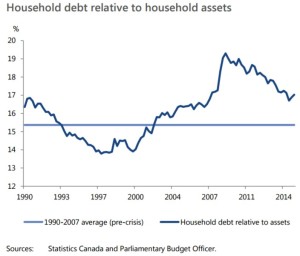
• Measured relative to household assets, household debt has moderated in recent years. In the third quarter of 2015, household debt accounted for 17.0 per cent of household assets. But this was still above the average of 15.4 per cent prior to the global financial crisis.
• Analysis conducted at the Bank of Canada suggests that low interest rates, higher house prices and financial innovation have contributed to the increase in household indebtedness.
(カナダ国民の家計の負債は、引き続き高い。
・2000年以来、
・対家計資産比家計負債は緩やかに収束し、
・カナダ中央銀行の分析は、低金利、住宅価格高、
… see Summary Figure 1 (Household debt service ratios)
Based on PBO’s November 2015 Economic and Fiscal Outlook, we project that household debt will continue to rise, reaching 174 per cent of disposable income in late 2016, before returning close to current levels by the end of 2020.
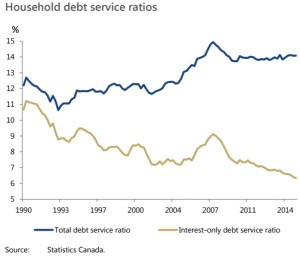
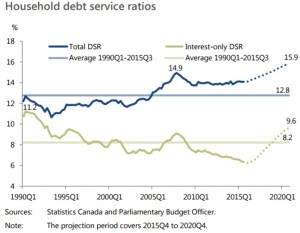
Household debt-servicing capacity will become stretched further as interest rates rise to “normal” levels over the next five years. By the end of 2020, the total household DSR, that is principal plus interest, is projected to increase from 14.1 per cent of disposable income in the third quarter of 2015 to 15.9 per cent.
(家計負債は増え続け、
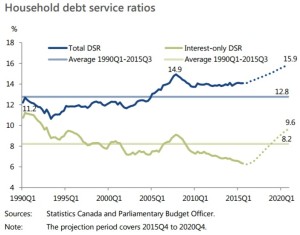
Based on PBO’s projection, the financial vulnerability of the average household would rise to levels beyond historical experience.
• The projected increase in the total DSR to 15.9 per cent would be 3.1 percentage points above the long-term historical average of 12.8 per cent (from 1990Q1 to 2015Q3). It would also be almost one full percentage point above its highest level over the past 25 years, 14.9 per cent, which was reached in 2007Q4.
(連邦議会予算官の予測に基づくと、
・上記DSR増は(
…
[本文・抜粋excerpts]
1. Introduction
Section 2 examines trends in household indebtedness since the early 1990s. Section 3 incorporates household assets into the analysis and examines the evolution of household debt relative to assets. Section 4 presents and discusses trends in household debt-servicing capacity. The concluding Section 5 presents a medium-term outlook for household debt and debt-servicing capacity based on PBO’s November 2015 Economic and Fiscal Outlook.
2. Household Debt
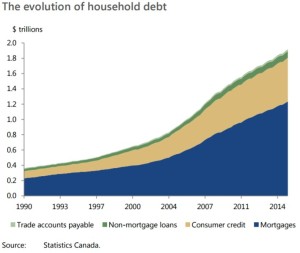
Statistics Canada identifies four major sources of household debt:
1. mortgages,
2. consumer credit,
3. non-mortgage loans and
4. trade accounts payable.
Mortgages are loans for the purchase of homes. Consumer credit includes loans for the purchase of consumer goods and other personal services, for example, a car loan or credit card debt. Non-mortgage loans are loans not intended for the purchase of consumer goods or personal services, for example, a loan to purchase securities. Finally, trade payables are short-term credit received in the ordinary course of business by suppliers of business goods and services.
Since 1991, household debt has increased each quarter, on average, by almost 7 per cent on a year-over-year basis, with the sharpest acceleration occurring over 2002 to 2008 (Figure 2-1: The evolution of household debt). In the third quarter of 2015, household debt amounted to $1.9 trillion.
Over the past 25 years, the proportional breakdown of debt has remained broadly stable. On average, mortgages have represented about 63 per cent of households’ total financial obligations; consumer credit, 29 per cent; and non-mortgage loans and trade accounts payable, 8 per cent.
Over the past 25 years, total household debt obligations relative to disposable income have almost doubled (Figure 2-2: Household debt relative to disposable income).
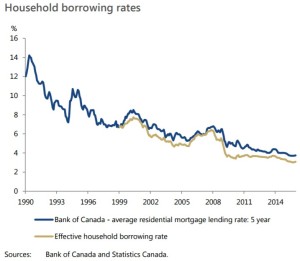
As interest rates have fallen, the demand for mortgage credit has increased, stimulating both house prices and household debt. The effective household borrowing rate has declined from 6.7 per cent in January 1999 to 3.1 per cent in December 2015 (Figure 2-3: Household borrowing rate).
Despite the increase in house prices during this period, historically-low interest rates and growth in household incomes have helped to maintain the overall affordability of mortgages close to the average level observed prior to global financial crisis (Figure 2-4: Bank of Canada index of housing affordability). Crawford and Faruqui (2012) suggested that changes to the affordability of mortgages have been a significant driver of the rise in mortgage credit since the 1990s.
Crawford and Faruqui (2012) noted that rising house prices increased total household debt levels in two ways:
1. By increasing the mortgages required for home buyers, and
2. By providing some households with more collateral for personal lines of credit (PLCs), encouraging higher consumer credit.
The upward trend in household indebtedness is reflected in the debt-to-income ratio in other G7 countries, based on statistics compiled by the Organisation for Economic Co-operation and Development (OECD) (Figure 2-5: Household debt-to-income ratios in G7 countries).
3. Household assets
Total assets are divided almost evenly between financial and non-financial assets. They increased from $2.2 trillion in 1990 to $11.3 trillion (measured at market value) by the end of the third quarter of 2015 (Figure 3-1: Financial and non-financial assets of households).
Household financial assets consist of the following four broad categories:
1. life insurance and pensions,
2. equity and investment fund shares,
3. currency and deposits, and
4. other financial assets
Non-financial assets of households consist of the following four broad categories:
1. residential structures
2. land
3. consumer durables, and
4. other non-financial assets.
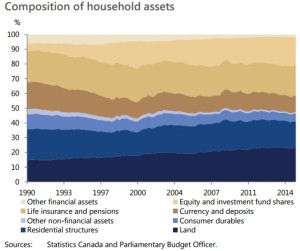
As a share of non-financial assets, the proportion of land and residential structures has increased since 1990 (Figure 3-2: Composition of household assets).
An increase in the debt-to-asset ratio indicates that households are becoming more leveraged. Figure 3-3 (Household debt relative to household assets) shows the evolution of the debt-to-asset ratio over time. Since 1990, this measure has fluctuated between 14 per cent and 19 per cent.
4. Debt-Servicing Capacity
Households that are required to devote a substantial portion of their disposable income to service their debts are vulnerable to negative income and interest rate shocks, and are more likely to be delinquent in their debt payments. Financial vulnerability is typically assessed by examining a household’s debt service ratio (DSR). Debt service ratio = Obligated debt payments / Disposable income
While the interest-only DSR has trended downward since 1990, the total DSR remained relatively stable over 1990 to 2004 but then increased sharply through 2007 (Figure 4-1: Household debt service ratios).
5. Medium-Term Outlook
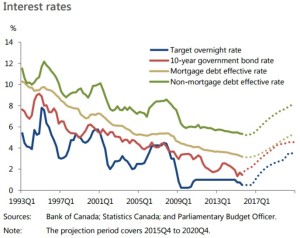
In PBO’s November 2015 outlook, the target for the overnight rate was projected to increase from its current level of 0.5 per cent to 3.5 per cent by the end of 2020; similarly the 10-year benchmark bond rate was projected to increase from 1.5 percent to 4.5 per cent over the same period (Figure 5-1: Interest rates).
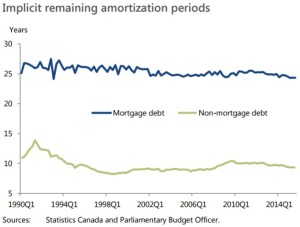
Although Statistics Canada does not provide series for the remaining amortization periods, we can use the above relationship to calculate an implicit estimate that is consistent with the observed total DSR, the historical
effective interest rate and the debt-to-income ratio data (Figure 5-2: Implicit remaining amortization periods).
Based on PBO’s November 2015 outlook, household debt is projected to increase from 171 per cent of disposable income in the third quarter of 2015 to a high of 174 per cent in the third quarter of 2016 (Figure 5-3: Household debt relative to disposable income). The projected increase reflects continued gains in real house prices.
However, as the Bank of Canada raises its target for the overnight rate, beginning in the fourth quarter of 2016, short- and long-term interest rates rise steadily. At the same time, real house price gains are projected to moderate. As a consequence, household debt relative to income is projected to decline gradually, falling to just below its current level; in 2020, it would average 169 per cent.
PBO projects that household debt-servicing capacity will be stretched further over the medium term as interest rates return to more normal levels. The total household DSR is projected to increase from 14.1 per cent to 15.9 per cent (Figure 5-4: Household debt service ratios = same as Summary Figure 1).
Unlike the benchmarks used by financial institutions for assessing an individual household’s financial vulnerability, a threshold for the economy-wide debt service ratio does not exist. However, to gauge the vulnerability at the aggregate level, it can be informative to compare the projected results for the total DSR to historical experience.
参考
A dash of data: Spotlight on Canadian households | #OECDInsights (カナダ国民の家計 | OECD)
National balance sheet and financial flow accounts, first quarter 2016(w PDF, June 14, 2016) | @StatCan_eng (
All the below links are in English.
弊社ツイッターアカウントの一つ @WSjp_insight のRTによる paper.li 掲載記事6件を貼っておきます。
Seattle’s Icicle Seafoods to be sold to Canadian aquaculture giant | @seattletimes
WSjp Australia Vol.4: @RBAInfo Bulletin June Quarter 2016 – Household Wealth, Manufacturing
Australia has moved 1.5 metres in 20 years and GPS can’t keep up | @keithbreene @wef
Why London won’t lose its crown as Europe’s financial capital | @CapX
Foreign Direct Investment (FDI) in the United States | @SelectUSA