
(All the below links are in English.)
Household Indebtedness and Financial Vulnerability (PDF, 19 January 2016) | @PBO_DPB 国民家計の負債と金銭的脆弱性 | カナダ連邦議会予算官(Parliamentary Budget Officer)本文抜粋・一部抄訳です。
Executive Summary 〔抜粋excerpts〕
…
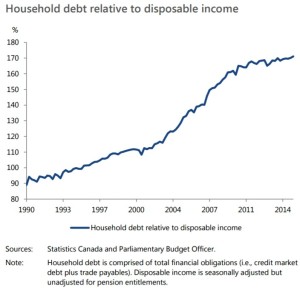
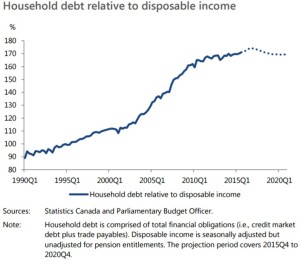
The indebtedness of Canadian households continues to trend higher. In the third quarter of 2015, total household debt (i.e., credit market debt plus trade payables) reached 171 per cent of disposable income. In other words, for every $100 of disposable income, households had debt obligations of $171. This is the highest level recorded since 1990.
• Among G7 countries, Canada has experienced the largest increase in household debt relative to income since 2000. Households in Canada have become more indebted than any other G7 country over recent history.
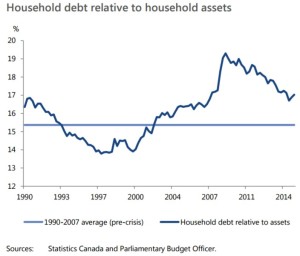
• Measured relative to household assets, household debt has moderated in recent years. In the third quarter of 2015, household debt accounted for 17.0 per cent of household assets. But this was still above the average of 15.4 per cent prior to the global financial crisis.
• Analysis conducted at the Bank of Canada suggests that low interest rates, higher house prices and financial innovation have contributed to the increase in household indebtedness.
(カナダ国民の家計の負債は、引き続き高い。
・2000年以来、
・対家計資産比家計負債は緩やかに収束し、
・カナダ中央銀行の分析は、低金利、住宅価格高、
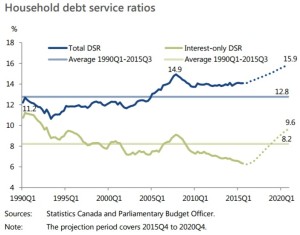
… see Summary Figure 1 (Household debt service ratios)
Based on PBO’s November 2015 Economic and Fiscal Outlook, we project that household debt will continue to rise, reaching 174 per cent of disposable income in late 2016, before returning close to current levels by the end of 2020.
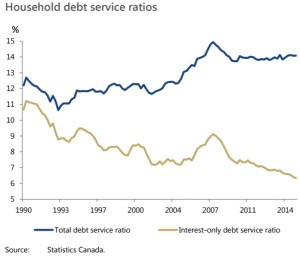
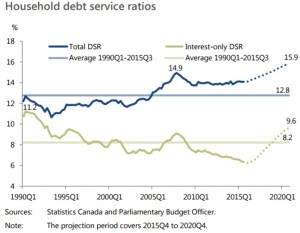
Household debt-servicing capacity will become stretched further as interest rates rise to “normal” levels over the next five years. By the end of 2020, the total household DSR, that is principal plus interest, is projected to increase from 14.1 per cent of disposable income in the third quarter of 2015 to 15.9 per cent.
(家計負債は増え続け、
Based on PBO’s projection, the financial vulnerability of the average household would rise to levels beyond historical experience.
• The projected increase in the total DSR to 15.9 per cent would be 3.1 percentage points above the long-term historical average of 12.8 per cent (from 1990Q1 to 2015Q3). It would also be almost one full percentage point above its highest level over the past 25 years, 14.9 per cent, which was reached in 2007Q4.
(連邦議会予算官の予測に基づくと、
・上記DSR増は(
…
[本文・抜粋excerpts]
1. Introduction
Section 2 examines trends in household indebtedness since the early 1990s. Section 3 incorporates household assets into the analysis and examines the evolution of household debt relative to assets. Section 4 presents and discusses trends in household debt-servicing capacity. The concluding Section 5 presents a medium-term outlook for household debt and debt-servicing capacity based on PBO’s November 2015 Economic and Fiscal Outlook.
2. Household Debt
Statistics Canada identifies four major sources of household debt:
1. mortgages,
2. consumer credit,
3. non-mortgage loans and
4. trade accounts payable.
Mortgages are loans for the purchase of homes. Consumer credit includes loans for the purchase of consumer goods and other personal services, for example, a car loan or credit card debt. Non-mortgage loans are loans not intended for the purchase of consumer goods or personal services, for example, a loan to purchase securities. Finally, trade payables are short-term credit received in the ordinary course of business by suppliers of business goods and services.
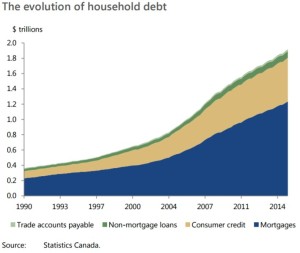
Since 1991, household debt has increased each quarter, on average, by almost 7 per cent on a year-over-year basis, with the sharpest acceleration occurring over 2002 to 2008 (Figure 2-1: The evolution of household debt). In the third quarter of 2015, household debt amounted to $1.9 trillion.
Over the past 25 years, the proportional breakdown of debt has remained broadly stable. On average, mortgages have represented about 63 per cent of households’ total financial obligations; consumer credit, 29 per cent; and non-mortgage loans and trade accounts payable, 8 per cent.
Over the past 25 years, total household debt obligations relative to disposable income have almost doubled (Figure 2-2: Household debt relative to disposable income).
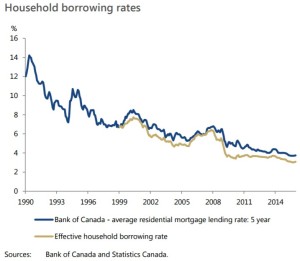
As interest rates have fallen, the demand for mortgage credit has increased, stimulating both house prices and household debt. The effective household borrowing rate has declined from 6.7 per cent in January 1999 to 3.1 per cent in December 2015 (Figure 2-3: Household borrowing rate).
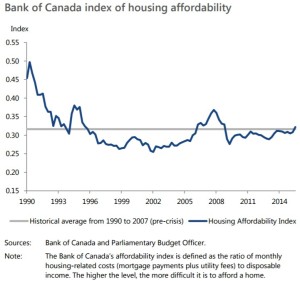
Despite the increase in house prices during this period, historically-low interest rates and growth in household incomes have helped to maintain the overall affordability of mortgages close to the average level observed prior to global financial crisis (Figure 2-4: Bank of Canada index of housing affordability). Crawford and Faruqui (2012) suggested that changes to the affordability of mortgages have been a significant driver of the rise in mortgage credit since the 1990s.
Crawford and Faruqui (2012) noted that rising house prices increased total household debt levels in two ways:
1. By increasing the mortgages required for home buyers, and
2. By providing some households with more collateral for personal lines of credit (PLCs), encouraging higher consumer credit.
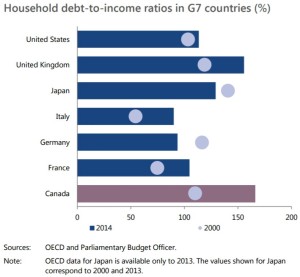
The upward trend in household indebtedness is reflected in the debt-to-income ratio in other G7 countries, based on statistics compiled by the Organisation for Economic Co-operation and Development (OECD) (Figure 2-5: Household debt-to-income ratios in G7 countries).
3. Household assets
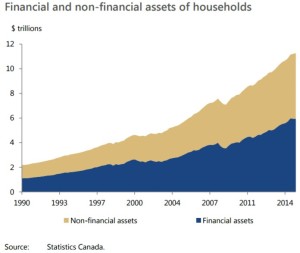
Total assets are divided almost evenly between financial and non-financial assets. They increased from $2.2 trillion in 1990 to $11.3 trillion (measured at market value) by the end of the third quarter of 2015 (Figure 3-1: Financial and non-financial assets of households).
Household financial assets consist of the following four broad categories:
1. life insurance and pensions,
2. equity and investment fund shares,
3. currency and deposits, and
4. other financial assets
Non-financial assets of households consist of the following four broad categories:
1. residential structures
2. land
3. consumer durables, and
4. other non-financial assets.
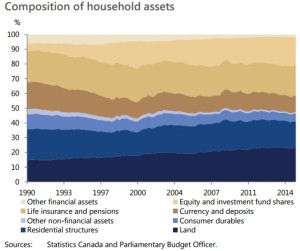
As a share of non-financial assets, the proportion of land and residential structures has increased since 1990 (Figure 3-2: Composition of household assets).
An increase in the debt-to-asset ratio indicates that households are becoming more leveraged. Figure 3-3 (Household debt relative to household assets) shows the evolution of the debt-to-asset ratio over time. Since 1990, this measure has fluctuated between 14 per cent and 19 per cent.
4. Debt-Servicing Capacity
Households that are required to devote a substantial portion of their disposable income to service their debts are vulnerable to negative income and interest rate shocks, and are more likely to be delinquent in their debt payments. Financial vulnerability is typically assessed by examining a household’s debt service ratio (DSR). Debt service ratio = Obligated debt payments / Disposable income
While the interest-only DSR has trended downward since 1990, the total DSR remained relatively stable over 1990 to 2004 but then increased sharply through 2007 (Figure 4-1: Household debt service ratios).
5. Medium-Term Outlook
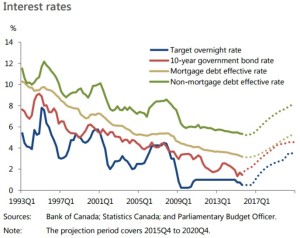
In PBO’s November 2015 outlook, the target for the overnight rate was projected to increase from its current level of 0.5 per cent to 3.5 per cent by the end of 2020; similarly the 10-year benchmark bond rate was projected to increase from 1.5 percent to 4.5 per cent over the same period (Figure 5-1: Interest rates).
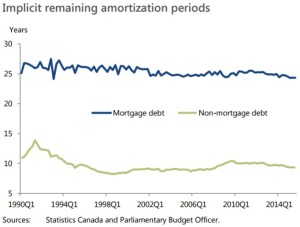
Although Statistics Canada does not provide series for the remaining amortization periods, we can use the above relationship to calculate an implicit estimate that is consistent with the observed total DSR, the historical
effective interest rate and the debt-to-income ratio data (Figure 5-2: Implicit remaining amortization periods).
Based on PBO’s November 2015 outlook, household debt is projected to increase from 171 per cent of disposable income in the third quarter of 2015 to a high of 174 per cent in the third quarter of 2016 (Figure 5-3: Household debt relative to disposable income). The projected increase reflects continued gains in real house prices.
However, as the Bank of Canada raises its target for the overnight rate, beginning in the fourth quarter of 2016, short- and long-term interest rates rise steadily. At the same time, real house price gains are projected to moderate. As a consequence, household debt relative to income is projected to decline gradually, falling to just below its current level; in 2020, it would average 169 per cent.
PBO projects that household debt-servicing capacity will be stretched further over the medium term as interest rates return to more normal levels. The total household DSR is projected to increase from 14.1 per cent to 15.9 per cent (Figure 5-4: Household debt service ratios = same as Summary Figure 1).
Unlike the benchmarks used by financial institutions for assessing an individual household’s financial vulnerability, a threshold for the economy-wide debt service ratio does not exist. However, to gauge the vulnerability at the aggregate level, it can be informative to compare the projected results for the total DSR to historical experience.
参考
A dash of data: Spotlight on Canadian households | #OECDInsights (カナダ国民の家計 | OECD)
National balance sheet and financial flow accounts, first quarter 2016(w PDF, June 14, 2016) | @StatCan_eng (