
アイルランド中央銀行の2016年第1四半期レポート Quarterly Financial Accounts Q1 2016 (18 August 2016): Irish households become the fourth most indebted in Europe | @centralbank_ie 概要・抜粋(abstract/excerpts) です。
[概要abstract]
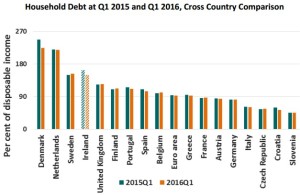
1. Irish households fell from being the third most indebted in the European Union to the fourth most indebted during Q1 2016. This was largely due to the continued reduction in Irish household debt, as well as, further increases in Irish disposable income.
(アイルランド国民の家計は、2016年第1四半期には、EU加盟国中借金が多い3番目から4番目へとなった。可処分所得が一層増えたことと、家計負債が引き続き減ったことが大きい。)
2.Household debt as a proportion of disposable income now stands at 149.4 per cent. That is its lowest level since end-2004.
(可処分所得に対する家計負債は、今、149.4%である。2004年末以来の最低レベルである。)
3. Households net worth increased by 0.3 per cent to reach €628.7bn, or €132,141 per capita. The increase in net worth was largely driven by a rise in housing asset values (€1.7bn), as well as a further decline in household liabilities (€0.9bn).
(家計の純資産は、0.3%増の6287億ユーロ、国民一人あたり132141ユーロに達した。家計負債の更なる9億ドルの減少と、住宅財産価値の17億ドルの上昇による。)
4. NFC debt to GDP declined by 9.8 percentage point over the quarter, falling to €257.3bn. Irish NFC debt has been extremely volatile in recent quarters due to the impact of domiciled MNCs on debt and GDP.
(non-financial corporations 非金融法人の総負債は第1四半期に2573億ユーロとなり、対GDP比率は9.8%減った。アイルランド国内に本社を置く multinational corporations 多国籍企業が総負債やGDPへの影響を持つため、最近のいくつかの四半期において非金融法人の総負債は極端に揺れ動いている。)
[補足・抜粋excerpts]
1. Net Lending/Borrowing of All Sectors (Chart 1.1 関連)
The domestic economy continued to be a net lender to the rest of the world during Q1 2016, as the net borrowing of government and financial corporations was exceeded by deleveraging by households and non-financial corporations…
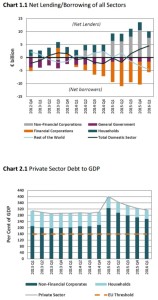
2. Private Sector Debt (Chart 2.1 関連)
… CSO revisions to the National Accounts and International Investment Position… redomiciling of some corporations and corporate restructuring… contributed to significant increases in GDP and NFC debt from 2014 onwards. Private sector debt as a percentage of GDP peaked in Q1 2015 at 400.7 per cent, and has since declined substantially to 315.2 per cent in Q1 2016. … primarily by growth in annualised GDP over the period, but is also reflective of falling private sector debt, which has contracted by 3.7 per cent since Q1 2015. …
3. Household Sector
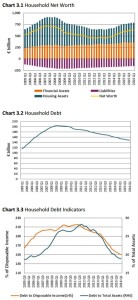
Chart 3.1 関連
… This was partially offset by a decline in households’ holdings of financial assets (€0.5bm). Compared to a post-crisis low of €454.1bn in Q2 2012, household net worth has risen by 38.5 per cent. However, it is still 12.4 per cent lower than its pre-crisis peak of €718bn in Q2 2007.
Chart 3.2 関連
Household debt continued to decrease during Q1 2016, falling by €1.1bn, or 0.7 per cent, to €148.5bn. This represented a household debt per capita of €31,216. Household debt is at its lowest level since Q1 2006. …
Chart 3.3 関連
Indicators of household debt sustainability continued to improve during Q1 2016. Debt as a proportion of disposable income fell over the quarter, from 152.7 per cent to 149.4 per cent, reflecting both the decline in household debt, as well as strong growth in annualised disposable income. …
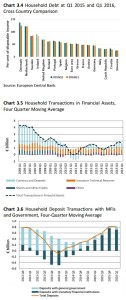
Chart 3.4 関連
… Over the year Danish household debt fell significantly more than any other country examined, declining by 23.2 percentage points. In contrast to this, Swedish households saw a 4 percentage point increase over the same period as they climbed to become the third most indebted in the European Union, with a household debt level of 153.5 per cent of disposable income.
Chart 3.5 関連
… The reduction in financial assets over the quarter largely reflected a fall in transactions of insurance technical reserves. … The majority of households’ financial investments over the quarter were in the form of currency & deposits, while shares & other equity experienced positive transactions for the first time since Q4 2013.
Chart 3.6 関連
… This marked the first time since Q4 2013 that household deposit transactions with MFIs (monetary financial institutions) had declined. In contrast, households increased lodgements with government deposit accounts for the first time since Q1 2013.
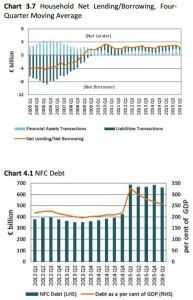
Chart 3.7 関連
… Over recent quarters net lending has become increasingly driven by higher investment in financial assets, as opposed to deleveraging.
4. Non-Financial Corporation Sector
Irish NFCs are significantly impacted by the activities of large MNCs. These latest NFC results incorporate the recent annual revisions to the CSO’s International Investment Position (IIP). The revisions include large MNCs which redomiciled to Ireland or moved significant parts of their balance sheets to Ireland during 2014 and 2015. These entities also contributed towards some of the very substantial increase in Irish GDP for 2015.
Chart 4.1 関連
… The decline in debt over the past year largely reflected exchange rate movements. Debt as a percentage of GDP fell from 327.5 per cent in Q1 2015 to 257.3 per cent in Q1 2016. This reflected both falling NFC debt, as well as, substantial GDP growth during 2015.
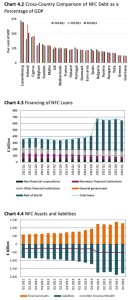
Chart 4.2 関連
… Luxembourg, which also has a lot of large MNCs relative to the size of its economy, had the highest debt at 349 per cent of GDP. … how volatile Irish NFC debt to GDP has been in recent years compared to other euro area countries.
Chart 4.3 関連
… The substantial increase in debt held by non-residents reflects this corporate activity and explains why exchange rate movements have had a significant impact on NFC debt in some quarters. …debt held by Irish residents has been on a downward trend in recent years. …partly reflected NFC deleveraging with Irish MFIs.
Chart 4.4 関連
…largely reflected MNC activities. Net financial assets (financial assets minus liabilities) became even more negative since Q1 2015. This is because some MNCs had large non-financial assets or relocated substantial non-financial assets to Ireland.