All the below links and excerpts (incl Figures 6-8 & 10-12) are in English.
The Art of the TRADE DEAL – Quantifying the Benefits of a TPP without the United States (PDF; 06/2017) | Canada West Foundation
p2 Executive Summary … Our modelling and analysis shows how Canada and other TPP signatories would fare under a TPP11; what the U.S. stands to lose; and, how the agreement would affect different sectors of the economy, including how changes in one sector will impact other sectors. …
… Is the endgame of a TPP11 solely its economic benefits, primarily in trade in goods and services? How should the eleven TPP countries deal with issues on which U.S. policy is shifting? Should potential losses for the U.S. from opting out be used to try and bring the Americans back to the TPP table to regain the additional benefits for all (and avoid aggressive bilateral talks)? If so, what changes, if any, should be made to the pact to either facilitate the Americans’ return to the table or, on the other hand, to try and extract concessions from them as a price for re-entry?
pp4-5 Major Findings from TPP11 modelling
FOR CANADA
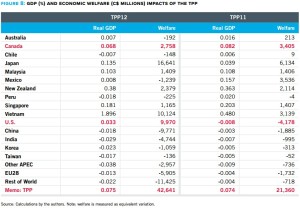
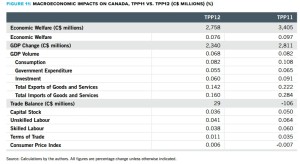
⭢ Canada stands to benefit in TPP11 compared to TPP12 more than any other country in the group, save Mexico. Canada’s welfare gains would improve to C$3.4 billion under the TPP11, compared to C$2.8 billion in TPP12. Real GDP gain improves to 0.082%. from 0.068%.
⭢ A TPP11 would actually be better than the original agreement for Canadian agriculture and agri-food, because this sector would no longer compete with the U.S. in TPP11 markets. Beef, in particular, would benefit from access to the Japanese market without having to share with the Americans. Fruit and vegetable exports, processed food products, and pork and poultry would likewise do well. Canola would continue to see a significant change in the composition of exports from unprocessed oilseeds to crude and refined canola oil, due to the elimination of Japan’s tariff escalation policy in the oilseed sector.
⭢ The only Canadian sector with a significant negative impact relative to the pre-TPP baseline would be dairy, which would face increased imports under Canada’s concession – in both TPP12 or 11. Because the main global dairy producer, New Zealand, is geographically distant from Canada, the U.S. would have been more important competition to Canada in terms of fluid milk. Without the U.S., TPP11 may mean less pressure on fluid milk. But …
⭢ Canadian textiles and apparel – another sensitive sector – would see only a moderate reduction in total shipments, despite a strong surge of imports from TPP11 partners (again, this is unchanged from TPP12).
⭢ The impact on the automotive sector is neutral in the new modelling results, but much would depend on how a TPP11 would proceed on the rules of origin (ROOs), given the central role of U.S.-based producers in TPP automotive supply chains.
FOR OTHER TPP11 COUNTRIES
⭢ A TPP11 would improve upon TPP12 for signatories in the Americas (Mexico, Canada, Peru and Chile), as these countries would avoid erosion of existing preferences in the U.S. market (assuming existing bilateral agreements remain unchanged). These countries would also benefit from not having to compete with U.S. suppliers, as they would have had to under TPP12.
⭢ A TPP11 would improve upon TPP12 for Singapore, which similarly would avoid loss to U.S. competition of its existing preferential position in Asian markets.
⭢ Vietnam and Japan, while they would still benefit from TPP11, would also see the biggest reduction of gains, because they stood to gain the most in the U.S. market under TPP12.
FOR SPECIFIC SECTORS
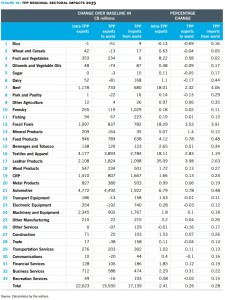
⭢ Notwithstanding the withdrawal of the U.S., the automotive sector would make the largest intra-TPP export gains of all the goods sectors under TPP11.
⭢ Other sectors that would benefit from increased exports under TPP11 include machinery and equipment (C$2.3 billion), leather products (C$2.1 billion), beef (C$1.2 billion), processed foods (C$946 million) and fruit and vegetables (C$343 million).
⭢ The TPP11 would wash out the large export gains that Vietnam stood to make in textiles and apparel in the U.S. market under TPP12. Nonetheless, textiles and apparel (C$4.2 billion) see the largest gains in intra-TPP exports after automotive products.
⭢ Finally, service exports get little wind in the sails from TPP11. Business services exports make the most notable gain, expanding by C$345 million, but this falls far short of what TPP12 would likely generate.
pp6-7
TWO REASONS TO PROCEED
01 Economic Gains
02 Negotiating Leverage
An Important Caveat for Policy-Makers
TPP & NAFTA
p9 INTRODUCTION
01 Does TPP11 make sense for the eleven as a standalone agreement?
02 Does the existence of TPP11 give signatories leverage in potential bilateral (or in the case of nafta, trilateral) negotiations or renegotiations with the U.S.?
03 Could the losses to the U.S. due to its exclusion from the tpp bring the Americans back to the table? Essentially, could TPP11 be a path to realizing or re-achieving the larger political and economic benefits of a TPP12?
… If a company in Japan that produces goods with inputs from Malaysia and Vietnam wanted to sell to Canada, it could enter Canada under the favourable conditions of TPP11 since all the countries were members of the agreement.
A bilateral agreement between the U.S. and Japan would apply only to goods made only or mostly in Japan and the U.S. For the Japanese company that has supply and production chains in Vietnam and Malaysia, this would pose a major problem. …
pp12-13 BACKGROUND
Figure 1: Income and Population, estimated 2016, TPP11 and the U.S.
Figure 2: Global imports, TPP11 parties and the U.S., 2015 (us$ millions)
Figure 3: Inward and outward investment, TPP11 parties and the U.S., 2015 (current us$ millions)
p15 Framework for QUANTITATIVE ANALYSIS
The GTAP-FDI model … On the production side, the model evaluates efficiency gains from the reallocation of factors of production across sectors. …
On the demand side, an aggregate Cobb-Douglas utility function allocates expenditures to private consumption, government spending, and savings to maximize per capita aggregate utility. …
pp24-32 Trade Impacts
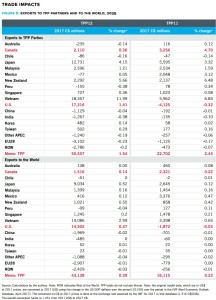
Figure 6: Exports to TPP partners and to the world, 2035
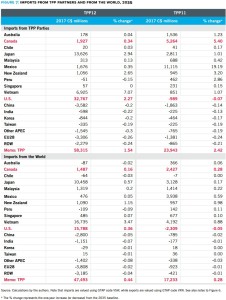
Figure 7: Imports from TPP partners and from the world, 2035
Figure 8: Gdp (%) and economic welfare (c$ millions) impacts of the TPP
Figure 9: Decomposition of TPP11 impacts by policy, cumulated change in 2035
Figure 10: TPP regional sectoral impacts 2035
Figure 11: Macroeconomic impacts on Canada, TPP11 vs. TPP12 (c$ millions) (%)
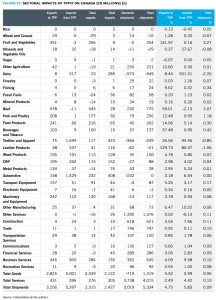
Figure 12: Sectoral impacts of TPP11 on Canada (c$ millions) (%)
pp34-35 DISCUSSION & CONCLUSIONS
… The biggest prize for Canada in a TPP11 is gaining access to Japan ahead of the U.S. and on terms that Canada could not achieve in a bilateral negotiation. This is the opposite of what happened to Canada in Korea where both the Americans and Australians were able to sign trade agreements ahead of Canada and take market share from our agricultural and livestock exporters. …
… The TPP12 featured a significant lowering of the overall amount of RVC required for an automotive product to qualify for TPP preferences compared to the NAFTA standard of 62.5% for automobiles and light trucks. …
COMPREHENSIVE AND PROGRESSIVE AGREEMENT FOR TRANS-PACIFIC PARTNERSHIP (TPP-11) – ANALYSIS OF REGULATORY IMPACT ON AUSTRALIA (PDF; 21/03/2018) | Parliament of Australia
PART 2: PROBLEM IDENTIFICATION
p3 Tariff barriers still faced by Australian exporters
15. With Japan, Australia has secured increased access for many products under the Japan-Australia Economic Partnership Agreement (JAEPA), but will continue to face high tariffs and quota-limited access on Japan’s sensitive products. In dairy, products face ad valorem tariffs ranging up to 40 per cent and specific tariffs up to \1,199/kg ($12.62/kg). Beef tariffs, while significantly reduced under JAEPA, would still be as high as 23.5 per cent after 15 years. Wheat and barley face tariffs of up to \50/kg ($0.58/kg) and \39/kg ($0.45/kg) respectively, rice is subject to a \341/ kg tariff ($3.93/kg) and sugar is subject to a levy on high polarity sugar of 103.10 yen/kg ($1.19-kg). A range of tariffs also remain on other Australian interests in horticulture and seafood.
19. Access into the Canadian dairy market is currently significantly limited by existing quota and high tariff arrangements. Canada’s quota access for dairy products is incredibly small – for example, 332 tonnes for yoghurt, 394 tonnes for cream and 3,274 tonne for butter (2,000 tonnes of which are allocated to New Zealand). While out-of-quota tariffs range up to 369 per cent. Outside of dairy, Canada also imposes tariffs of up to 94 per cent for barley products, and imposes tariffs of 1.87 c/litre for wine, and up to around 20 per cent on industrial products, which it has eliminated for its other FTA partners.
20. Mexico has tariffs of up to 67 per cent on wheat, 115.2 per cent on barley, 125 per cent on dairy, 25 per cent on beef, and 20 per cent on wine. On industrial products, Mexico’s tariffs can range from 15 to 30 per cent for automotive parts or mining equipment.
PART 5: IMPACT ANALYSIS
pp15-19 Table 3: Key agricultural market access outcomes for Australia
pp19-20 Resources, Energy and Manufactured Good
pp28-34 Suspension of TPP provisions in TPP-11
pp35-38 PART 6: TRADE IMPACT ASSESSMENT
p41 PART 9: IMPLEMENTATION AND REVIEW
113. A TPP-11 Commission established under the Agreement will be responsible for the operation of the TPP-11. The Commission will review the operation of the TPP-11 three years after entry into force of the Agreement and at least every five years thereafter. If the entry into force of the original TPP is imminent or if the original TPP is unlikely to enter into force, the Parties have agreed to, on the request of a Party, review the operation of the TPP-11 so as to consider any amendment to the Agreement and any related matters.
114. After the entry into force of the TPP-11, any state or separate customs territory may accede to the TPP-11 if it is prepared to comply with the provisions of the Agreement, other terms and conditions specified, and if all TPP-11 Parties agree to the accession.
115. Any Party may withdraw from the TPP-11 by providing written notice to the Depositary and other Parties. A withdrawal shall take effect six months after a Party provides written notification, unless the Parties agree on a different period.
JSCOT (Joint Standing Committee on Treaties) inquiry into the Comprehensive and Progressive Agreement for Trans-Pacific Partnership (TPP-11) (PDF; 04/20/2018) | Australian Chamber of Commerce and Industry
pp4-6 2 Increased red tape and costs:
… It is important to understand that each agreement includes compliance terms which need to be satisfied in order to take advantage of the agreement. In the case of goods trade, this is the tariff regime where rules of origin must be satisfied. Zero preferential tariffs are different to the abolition of tariffs. Any tariff, even 0, requires the importers to satisfy the compliance rules and so red tape is retained. …
5 Further comments:
pp8-16 Annex 1: Previous Parliamentary Inquiry recommendations and resultant actions.
pp17-19 Annex 2: Previous Submission to the Senate Foreign Affairs, Defence and Trade References Committee TPP Inquiry, October 2016
p22 6 Contribution to economic prosperity from liberalised trade
… Australia held similar positions in the 1950s but its ranking slipped over the following two and a half decades. It dropped to 15th in 1983 and again in 1991 and 1992.
Since then Australia’s international ranking has risen. This improvement has been linked to sustained economic reforms during the 1980s and 1990s, including: the opening up of trade and capital markets to competition; partial deregulation, commercialisation and privatisation of state owned enterprises; labour market reforms that reformed the centralized wage fixing system; and National Competition Policy reforms (PC 1999). These resulted in better utilisation of labour and capital by business and enabled the Australian economy to innovate, taking advantage of newly developed information and communication technologies.
pp38-39 9.2 Economic studies
The Trans-Pacific Partnership Deal (TPP): What are the economic consequences for in- and outsiders? (PDF; 10/08/2015) | Rahel Aichele, Gabriel Felbermayr @ ifo Institut (@ Global Economic Dynamics, Bertelsmann Foundation)
Table 1 Effects of TPP and FTAAP on real per capita income in insider countries, %
Table 2 Real Income Effects of Pacific Mega Regionals on World Regions
Table 3 Real Income Effects of Pacific Mega Regionals in Europe and the US (%)
Table 4 Welfare Effects from TPP with Flexible Comparative Advantage
Table 5 The EU’s Importance in Global Sectoral Value Added with TPP and FTAAP
Table 6 Germany’s Importance in Global Sectoral Value Added with TPP and FTAAP
Table 7 Estimated trade policy effects, goods trade
Table 8 Estimated trade policy effects, services
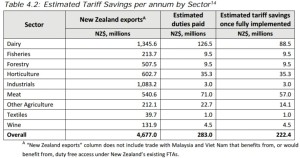
A good dealfrom TPP for NZ Horticulture (PDF; 11/2015) | Simon Hegarty (@ Horticulture New Zealand)
Trans-Pacific Partnership (TPP) – members & value of NZ hort exports to each
The following table highlights the outcome for nine key product lines
New Zealand wine sector welcomes agreement on CPTPP (PDF; 26/01/2018) | New Zealand Wine
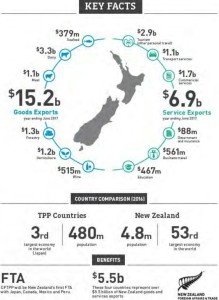
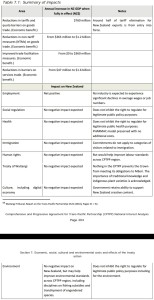
Trans-Pacific Partnership overview (PDF) | New Zealand Foreign Affairs & Trade
IS THE TRANS-PACIFIC PARTNERSHIP’S INVESTMENT CHAPTER THE NEW “GOLD STANDARD”? (PDF; 2016) | Jose E Alvarez
PROCESS, POLITICS AND THE POLITICS OF PROCESS: THE TRANS-PACIFIC PARTNERSHIP IN NEW ZEALAND (PDF) | Amokura Kawharu
Chile and the TPP Negotiations: Analysis of the economic and political impact (PDF; 05/2013) | ONG Derechos Digitales
17-10 Going It Alone in the Asia-Pacific: Regional Trade Agreements Without the United States (PDF; 10/2017) | Peter A. Petri, Michael G. Plummer, Shujiro Urata, and Fan Zhai (@ PIIE)
cf.
Trans-Pacific Partnership #TPP Vol.3 (Miscellaneous)
Australia Vol.15 / Trans-Pacific Partnership #TPP Vol.2

