(The below links are in English.)
1. Financial stability risks from housing market cycles (19/07/2016) | Michael Thornley @ReserveBankofNZ(住宅市場の循環による金融安定性のリスク)の本文抜粋です。
1 Introduction …the global financial crisis (GFC)…
2 Housing market boom-bust cycles 及び 3 Direct exposure of the financial system to the housing market
では、US、UK等、NZに特化しない国際的な事象につき説明されています。
4 Indirect exposure of the financial system to the housing market
Impact on household consumption(家計消費への影響)
There is substantial literature on how household consumption responds to changes in housing wealth. Some theories argue that consumption should be completely unresponsive to changes in house prices as (i) households can borrow against their future income to support consumption and (ii) houses are a consumption good in their own right,
so house price declines would not affect a home-owner’s net wealth if they coincide with a decline in rental prices.
These arguments, however, depend on households having standard preferences, rational asset prices and no credit market frictions. Empirical evidence suggests that, in practice, household consumption is affected by house prices. One study finds that during the GFC, US households on average reduced their consumption by $540 for every $10,000 decline in the value of their home…
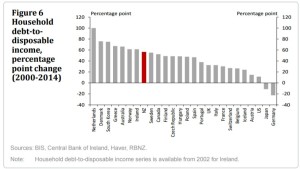
Recent research also suggests that the responsiveness of household consumption to house prices is affected by the size and distribution of household debt. This is particularly noteworthy, as household debt-to-disposable income ratios have grown substantially in many advanced economies since the turn of this century (figure 6). In New Zealand, this growth was driven mainly by mortgage debt…
…countries with high aggregate household debt to disposable income ratios in 2007 suffered larger reductions in consumption in 2007-12, when controlling for other factors. …when public and corporate debt increase above certain thresholds it is bad for GDP growth. A negative relationship between household debt (above 85 percent of GDP) and future growth is found but the estimate is extremely imprecise.
… There are broadly two reasons why highly indebted households might reduce consumption more than other households when facing income or housing wealth shocks. First, income and wealth shocks may cause households to increase precautionary savings in response to lower expectations for future income, and this response may be larger for more highly indebted households (the ‘precautionary savings channel’). Second, income and wealth shocks may cause lenders to disproportionately restrict lending to highly indebted households in response to lower expectations for future income and concerns about the collateral value of their homes (the ‘credit availability channel’). …
Impact on sectors related to the housing market(住宅市場関連分野への影響)
… A housing market downturn can affect the construction industry, for example, by reducing demand for new property, reducing the value of the portfolio of land they hold awaiting future construction or causing projects to be written off due to lack of funding. This was demonstrated in Ireland and Spain in the GFC, when a pre-crisis boom in construction collapsed and caused significant losses for the local banking systems. The collapse of the domestic housing markets resulted in severe losses for the financial system, forced government bail-outs (which in Ireland amounted to around 40 percent of GDP) and, ultimately, forced the governments to seek financial support from international agencies…
A housing downturn could also depress the commercial property market by reducing the value of land and property that leveraged commercial property developers have used as collateral to borrow against, threatening their solvency or future borrowing capacity. A relatively large proportion of bank losses in past financial crises are estimated to have come from loans to the commercial property sector… For example, prior to the Nordic and Japanese financial crises in the early 1990s, there was rapid growth in commercial property prices and construction, following a property boom fuelled by financial liberalisation. Significant loan losses were incurred when rising interest rates and slowing economic activity triggered a sharp fall in commercial property prices.
5 Summary and implications for financial stability in New Zealand
… A housing market downturn can cause ‘direct losses’ for banks on mortgage lending, with losses typically being larger on mortgages to highly levered borrowers. It can also contribute to ‘indirect losses’ on lending to sectors related to the housing market, such as the construction and commercial property sectors, and more generally, by affecting household consumption and economic activity. …
5.1 Assessment of housing market risks in New Zealand
The Reserve Bank has reason to be wary of these risks in New Zealand. New Zealand house prices have displayed a degree of cyclicality in recent years (figure 7) and although we have not seen a major decline in prices since the early 1980s, many other advanced economies have experienced sharp and significant declines in house prices, particularly during the GFC. In addition, New Zealand banks’ exposure to the housing market has increased in the past two decades: in aggregate, mortgage lending comprised less than 40 percent of banks’ overall lending portfolio in 1994 and has risen to around 52 percent today.
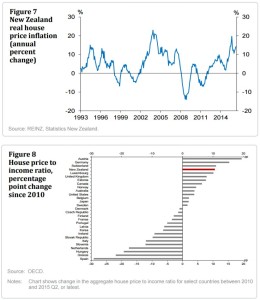
House prices in New Zealand were among the fastest growing in advanced economies last year and have grown faster relative to incomes than in most advanced economies in the five years after 2010 (figure 8). The house price to income ratio in Auckland rose to 9 in Q1 2016, high internationally and up significantly from 6 in 2012.
There are also signs that a significant proportion of new mortgage lending in New Zealand is highly levered. Currently, around 40 percent of residential mortgages are issued at more than five times the borrower’s gross annual income. Anecdotally, banks were much less willing to write mortgage loans this large relative to income in the aftermath of the GFC and also required substantial deposits. This cyclicality of mortgage supply could exacerbate cyclicality in the housing market, as a price-credit loop can fuel dramatic escalations in house prices and amplify sharp falls in prices.
Property investors may also amplify housing market cycles as they are more likely than owner-occupiers to purchase houses during a housing boom and sell during a housing crash, as their decisions are driven by profit-seeking behaviour. This is a risk in Auckland, where nearly half of recent house sales have been to investors.
It is difficult to estimate the amount house prices could decline in a housing market downturn and the subsequent losses the financial system could face. While the New Zealand market does not currently exhibit the moral hazard and weak mortgage underwriting standards exhibited in the US and Ireland prior to the GFC, there are still risks from high LVR and high DTI mortgages.
Changes in the size and distribution of household debt may have increased the financial stability risk from a housing downturn in recent years. Since 2000 the level of household debt-to-GDP has increased significantly in New Zealand, as in other advanced economies (figure 6). And of the households that took out new mortgages in the period 2011-13, a larger proportion did so at high LVR (>80%) and DTI multiples (>4), than in the period 2008-10 …these households are likely to reduce their consumption by more than other households in a house price crash.
…banks may significantly reduce their lending in an economic downturn, so highly indebted households may face tighter credit constraints and place a further drag on consumption.
5.2 Policy frameworks to mitigate housing market risks in New Zealand
One of the primary responsibilities of the Reserve Bank is to promote the maintenance of a sound and efficient financial system. The Reserve Bank has a number of policy options to help maintain financial stability. Microprudential policies, which include bank capital and liquidity regulations, promote the soundness and resilience of individual financial institutions, and therefore the integrity of the financial system as a whole.
Macroprudential policies, which include countercyclical capital buffers and temporary LVR restrictions, promote greater financial stability by (a) building additional financial system resilience during periods of rapid credit growth and rising leverage or abundant liquidity, and (b) dampening excessive growth in credit and asset prices. Therefore, the Reserve Bank can use both microprudential and macroprudential policies to mitigate the risk that housing market vulnerabilities pose to New Zealand’s financial system stability and the broader economy.
The financial system’s first line of defence against a housing market downturn is the loss-absorbing capital it holds against expected and unexpected losses on its mortgage lending and other exposures. To enhance the resilience of this defence, the Reserve Bank monitors banks’ provisioning against expected losses and requires banks to hold buffers of capital against unexpected losses, where the size of the buffer is determined by the size and riskiness of the lending. These capital requirements bolster the resilience of individual financial firms, even in a severe downturn, but in some circumstances they may not be sufficient to preserve the stability of the financial system as a whole. As the GFC demonstrated, the actions of individual banks, investors, firms and households are interconnected and can collectively result in financial system losses that are exceptional and unexpected when assessed from the perspective of an individual financial institution e.g. due to credit crunches or falls in consumption or investment.
… Stress test results are, however, subject to inherent uncertainty over the scenarios against which banks are tested and the approach to modelling losses on the basis of the given scenarios. Furthermore, the stress test assessed the resilience of banks to a ‘static’ scenario and do not take account of the on-going interaction between the macroeconomic and macro-financial elements of the scenarios and banks’ response to them. These second order effects can themselves be a threat to financial stability and can fall within the scope of the Reserve Bank’s macro-prudential policy instruments. In particular…discussed in section 4.
A second line of defence to protect the financial system from a housing market downturn is to reduce the potential scale of the downturn itself by using borrower-based macroprudential tools such as LVR and DTI limits. These measures may also temporarily reduce the probability of a housing downturn, although that is often not the primary objective.
In recent years, the national authorities of many countries, including the Reserve Bank, have taken some form of proactive action to mitigate the build-up of financial stability risks from their domestic housing market. In 2013, the Reserve Bank introduced a 10 percent speed limit on mortgage lending with an LVR of greater than 80 percent, which has helped reduce the stock of high LVR mortgages from 21 percent to 12 percent (figure 9). In addition, the Reserve Bank introduced a speed limit on high LVR investor mortgages in Auckland in November 2015 which appears to have moderated the nationwide share of investor lending at LVRs greater than 70 percent.
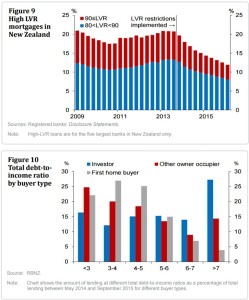
In many cases, national authorities use more than one macroprudential tool to tackle risks from the housing market. For example, it is common for caps on LVR and DTI to be applied together… The rationale for this approach is that in theory the macroprudential tools are complementary as they can tackle the same risks from various angles. For example, the LVR policy in New Zealand has helped to reduce the stock of risky high-LVR lending, but risks in the housing market remain, as a significant amount of New Zealand’s new residential mortgage lending, particularly to investors, is at high DTI multiples (figure 10).
2. Household debt (9/9/2016) | @ReserveBankofNZ(家計負債)
In the 20 years to 2011, total housing and consumer loan debt increased around six-fold in dollar terms. As a ratio of household disposable income, the percentage at June 2011 of 147% is about two and a half times that of 58% at March 1991. Through the mid-2000s, household debt grew strongly, at an average annual rate of over 14% in the five years to June 2007. The rate of growth slowed sharply from 2007, averaging well under 4% per annum in the four years to June 2011. …