日本のガラパゴス症候群 Vol.6(TimesHigherEducation World University Rankings 2016-2017 -THE世界大学ランキング2016)

The below three links (1.~3.) are in English.

the-world-university-rankings-2016-2017-methodology-small

以下、英語抜粋等です。日本人が英語圏の大学や研究機関に人的に入り込めれば、研究は評価され順位は上がる等となります。アジア何位かは考えず、日本が持っている素晴らしい研究成果をいかに評価させるかに執念を燃やし、どんどん人的に英語圏に入っていくことに弊社も微力ながらお手伝いできると考えております。4.は日本語です。

1.  World University Rankings 2016-2017: results announced (September 21, 2016) | @elliebothwell @THEworldunirank @timeshighered

… Overall, 289 Asian universities from 24 countries make the overall list of 980 institutions and an elite group of 19 are in the top 200, up from 15 last year.

When analysing which countries achieve the highest average scores, Singapore comes top on all five of the pillars underlying the ranking – teaching, research, citations, industry income and international outlook. Hong Kong is second for teaching, third for research and fourth for citations.

Rajika Bhandari, deputy vice-president of research and evaluation at the Institute of International Education and co-editor of the book Asia: The Next Higher Education Superpower?, said that the “sharp rise” of Asia’s universities is due to three main factors: rapidly growing populations and demand for higher education in the region; governments making “significant investments” in universities; and improvements by individual institutions.

On advances at university level, she said that many Asian scholars who studied at Western universities are now academics in their home countries and have “really begun to transform their own higher education sectors”.

They have “brought back to [their] home campuses some of the teaching values of critical thinking and liberal education, as well as the idea of promotion based on merit and research outputs”, she said.

She predicted that there will be continued expansion of cross-degree and campus partnerships among institutions in Asia and the West, as well as a “huge push towards intra-regional higher education partnerships and mobility within the Asia-Pacific region”.

However, Richard Robison, emeritus professor in the Asia Research Centre at Murdoch University (@MurdochUni), said while there are a “small number” of Asian universities “making international strides”, many are much further behind.

When asked whether he envisioned some Asian universities competing with the likes of Oxbridge and the Ivy League, he said: “I can’t see them becoming giant intellectual hubs that some big Western universities have become over a couple of hundred years because they have a different idea about education and a different way of going about it.”

He said that Asian universities create a “very pressured environment”, have “a lot of learning by rote” and there is “not a lot of discussion in classes”.

I don’t know if that would translate globally, except in some of the narrow scientific and technical areas,” he said.

2.  World University Rankings 2016-2017: Standing still is not an option (September 21, 2016) | @phil_baty @THEworldunirank @timeshighered

… In 2004, our ability to support the higher education community advanced when we became one of the world’s first organisations to publish a global university ranking. …

In 2010, our world rankings were dramatically enhanced when, after almost a year of open consultation with the global community, we delivered a much more comprehensive version of the THE World University Rankings. We employed for the first time our current balanced range of 13 performance indicators, introducing new metrics for teaching and knowledge transfer in addition to research excellence. …

The Times Higher Education World University Rankings 2016-17 – our 13th annual publication – lists 980 institutions from 79 countries. Last year, we ranked 801 universities from 70 countries, up from only 400 universities in 2014. This year, we were able to draw on a database with tens of thousands of data points on 1,313 of the world’s leading research-intensive universities, compared with the previous year’s total of 1,128 institutions.

This year, we can draw on more than 20,000 responses to our annual academic reputation surveys – 10,323 responses, from 133 countries, to the 2016 survey combined with the 10,507 from last year. This year, through our partner Elsevier (@ElsevierNews), we are also able to examine 56 million citations to 11.9 million publications published over the five years to 2015. Last year, we examined 51 million citations from 11.3 million publications.

Although the overall rankings methodology is the same as last year – we have further enhanced the analysis this time by including books among the research outputs we evaluate, in addition to journal articles, reviews and conference proceedings. Some 528,000 books and book chapters are included for the first time, giving a richer picture of the global research environment.

This year, in another pioneering move, our calculations have been audited by PricewaterhouseCoopers (@PwC_LLP). …

3.  World University Rankings 2016-2017 methodology (September 5, 2016) | @THEworldunirank @timeshighered

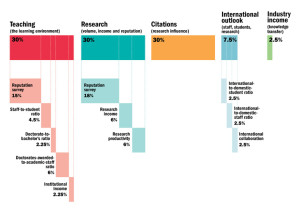
… The performance indicators are grouped into five areas:

  • Teaching (the learning environment)
  • Research (volume, income and reputation)
  • Citations (research influence)
  • International outlook (staff, students and research)
  • Industry income (knowledge transfer)

Data collection
Institutions provide and sign off their institutional data for use in the rankings. On the rare occasions when a particular data point is not provided we enter a low estimate between the average value of the indicators and the lowest value reported: the 25th percentile of the other indicators. By doing this, we avoid penalising an institution too harshly with a “zero” value for data that it overlooks or does not provide, but we do not reward it for withholding them.

Getting to the final result
… For all indicators except for the Academic Reputation Survey we calculate the cumulative probability function using a version of Z-scoring. The distribution of the data in the Academic Reputation Survey requires us to add an exponential component.

Teaching (the learning environment): 30%

  • Reputation survey: 15%
  • Staff-to-student ratio: 4.5%
  • Doctorate-to-bachelor’s ratio: 2.25%
  • Doctorates-awarded- to-academic-staff ratio: 6%
  • Institutional income: 2.25%

Research (volume, income and reputation): 30%

  • Reputation survey: 18%
  • Research income: 6%
  • Research productivity: 6%

Citations (research influence): 30%

Our research influence indicator looks at universities’ role in spreading new knowledge and ideas.

We examine research influence by capturing the number of times a university’s published work is cited by scholars globally. This year, our bibliometric data supplier Elsevier examined more than 56 million citations to 11.9 million journal articles, conference proceedings and books and book chapters published over five years. The data include the 23,000 academic journals indexed by Elsevier’s Scopus database and all indexed publications between 2011 and 2015. Citations to these publications made in the six years from 2011 to 2016 are also collected. …

International outlook (staff, students, research): 7.5%

  • International-to-domestic-student ratio: 2.5%
  • International-to-domestic-staff ratio: 2.5%
  • International collaboration: 2.5%

Industry income (knowledge transfer): 2.5%

A university’s ability to help industry with innovations, inventions and consultancy has become a core mission of the contemporary global academy. This category seeks to capture such knowledge-transfer activity by looking at how much research income an institution earns from industry (adjusted for PPP), scaled against the number of academic staff it employs. …

4.  THE世界大学ランキング2016 (2016年9月22日) | @ReseMom (Japanese)

「教育」「研究」「論文被引用数」「産業界からの収入」「国際性」を評価する13の指標をもとに各大学をランク付け・・・

ツイッター paper.li Vol.7

All the below links are in English.

弊社ツイッターアカウントの一つ @WSjp_insight のRTによる paper.li 掲載記事6件を貼っておきます。

Seattle’s Icicle Seafoods to be sold to Canadian aquaculture giant | @seattletimes

WSjp Australia Vol.4: @RBAInfo Bulletin June Quarter 2016 – Household Wealth, Manufacturing

Australia has moved 1.5 metres in 20 years and GPS can’t keep up | @keithbreene @wef

Melbourne researchers say they’ve developed a method of growing & implanting cornea cells | @abcnewsMelb

Why London won’t lose its crown as Europe’s financial capital | @CapX

Foreign Direct Investment (FDI) in the United States | @SelectUSA

ツイッター paper.li Vol.6

All the below links are in English.

弊社ツイッターアカウントの一つ @WSjp_insight のRTによる paper.li 掲載記事5件を貼っておきます。

@RBAInfo Bulletin June Quarter 2016 | @WSjp_insight

A new trade commission has warned the UK to treat China with “kid gloves”, and focus on attempts to secure deals with countries with “similar values” | @MkSands @CityAM

Spain’s Northern Coast by Private Rail | @ffdunlop @NatGeo

LifeSciences grant: 2016 Laureates #iGEM | @FranceScience

Franz Ferdinand, Whose Assassination Sparked a World War | @DSlotnik @nytimesworld

U.K. イギリス Vol.9(Brexit Vol.8: Japan’s Message to UK & EU 日本要望書)

(The below two links are in English, and the last one in Japanese.)

さて、当サイトでも今後、随時、Brexit につき情報をアップして参ります。
本日は、@ChathamHouse 関係の記事 Japan Lays Out a Guide to Brexit (6 September 2016) | Sir David Warren @CHAsiaProg(’日本がイギリスEU離脱の手引きを示す’)本文と抄訳をご紹介します。

– Britain would do well to embrace Tokyo’s constructive criticism as it prepares for life outside the EU.(EU域外での生き方を準備している日本の建設的な批判を、イギリスは包み込んで受け容れてうまくやっていける)

The Japanese government paper on the implications of Brexit released on 2 September has been described in the UK media as an ‘unprecedented’ and ‘dire’ warning, a ‘stark’ threat, and dismissed as ‘doom-mongering’. In reality, it is a carefully-argued and very detailed analysis of the areas of Brexit-related concern to the thousands of Japanese companies in the UK, and those aspects of the current business environment that they want to preserve in the forthcoming negotiations. Setting out the Japanese stall in this way risks annoying British negotiators with the responsibility of finding their way through the minefield of agreeing the terms of Britain’s divorce from Europe. But the Japanese analysis, used constructively, is an important guide to what really matters in ensuring that a post-Brexit UK is not only ‘open for business’, but a country that the world’s major investors want to do business with.
(9月2日に公表されたイギリスEU離脱に係る日本政府の要望書(下記参考英文)は、’前代未聞’で’切迫した’警告であり’正真正銘’の脅しであるとイギリスのメディアでは伝えられており、’恐怖を利用した’と切り捨てられている。しかし、日本の要望書は、イギリスEU離脱に係るイギリス国内の千単位の日本企業にとっての懸念について、また、今後の離脱交渉において日本企業にとって維持されたい現在の企業活動環境について、注意深く議論されまた非常に詳細に分析したものである。… 建設的に使えば、離脱後のイギリスが’企業活動にとって動き易い’のみならず世界の主な投資者が企業活動をしたい国であることを確保するのに真に問題となる事柄についての重要な手引きである。)

The paper is couched in terms of cooperation and partnership. Japanese inward investment into the UK has been one of the major industrial success stories of the last 40 years, with the 1984 decision of Nissan to build its car plant at Sunderland the turning point. The Japanese government and Japanese companies want to preserve this post-Brexit. But that means keeping radical changes to the current environment that might emerge from the Brexit talks to a minimum. Specifically, the Japanese want, among other things, to maintain current tariff rates and customs procedures, access to skills (including from within the EU), the current provision of financial services (50 per cent of the value of British manufactured goods is accounted for by services), the current arrangements for information protection and data exchange, unified intellectual property protection, harmonized standards and regulations, and access to the EU R&D budget and joint programmes. These requests are aimed at EU negotiators as well as at the UK. A 10-page annex goes into even more detail, sector by sector.
(… とりわけ日本が望むのは、関税率、税関手続き、EU域内も含めた人材へのアクセス、金融サービス条項、情報保護及び… →下記参考(日本語PDF3頁等)をご覧ください

The context of these requests is not just concern about Brexit. The paper makes clear that leading the free-trade system remains a responsibility shared by Japan, the UK and the EU. The Japanese government are nervously watching the US presidential election, with Donald Trump openly adopting a protectionist line and Hillary Clinton now opposed to the Trans-Pacific Partnership (TPP) trade deal; they will also have been concerned at suggestions from European politicians that the US−EU Transatlantic Trade and Investment Partnership (TTIP) may fail. Hence their statement – echoed by President Obama at the G20 in Hangzhou in his remarks on TTIP – that the priority must be to finalize the EU−Japan Economic Partnership Agreement this year. A post-Brexit UK−EU relationship that erects protectionist walls would, in Japan’s view, be a disaster for everyone.  The arguments in the paper are about preserving the health of the global economy.
(要望書はイギリスEU離脱への懸念を示しているだけではない。引き続き自由貿易をリードしていくことが日英欧において共有される責任であることが明確にされている。日本政府はアメリカ大統領選挙を神経質に見守っている。…)

And Japan calls for early clarity and transparency on the difficult issues.  The paper argues that uncertainty causes volatility, and warns against the negotiating process producing ‘unpleasant surprises’. This advice may be unwelcome to UK politicians and negotiators who have to work out how to trade off being part of the single market with the need to restrict freedom of movement.   This is a political dilemma that needs to be unravelled slowly; Britain’s economic partners’ need for early clarity runs directly counter to the politics which Prime Minister Theresa May and her cabinet have to manage over the coming months.
(そして日本は、難しい案件につき早期の明確化及び透明性を求めている。不確実性が市場の急激な変動を引き起こすと述べ、また、交渉過程が’嬉しくないサプライズ’をもたらすことを警告している。このアドバイスは、単一市場の一部であることと移動の自由を制限することの折り合いをいかに付けるかに尽力せねばならない政治家や交渉者からは、歓迎されないものかもしれない。これは、ゆっくりほどけて行かざるを得ない政治的ジレンマなのであるから。…)

The paper observes that ‘Japan respects the will of the British people as demonstrated in the referendum’ and express confidence that ‘the UK and the EU will overcome . . . difficulties and lay the foundations for the creation of a new Europe’. Nonetheless, the menu of requests is challenging and almost certainly impossible to fulfil in its entirety, if, as the prime minister has said, ‘Brexit means Brexit’. But it is a guide to what foreign businesses, attracted to the UK by successive governments with the promise of being inside the single market in an EU member state committed to further trade liberalization, want from the new arrangements. 
(要望書では、’日本はイギリス国民の投票の意思を尊重する’と述べられ、また … にもかかわらず … しかし、これは、外国企業がイギリスの今後の交渉過程において整えてもらいたいことに係る手引きなのである。…)

In that sense, it should also lift the level of current discussion on trade and investment relations away from the zero-sum political arguments during the referendum campaign – ‘being part of Europe’ versus ‘free trade agreements with the rest of the world’.  Japan is saying, very clearly, that it is not an either/or choice. If the UK is to remain one of the world’s largest and most powerful economies – which, however much it is talked down in Britain, it still is – it is going to have to have a relationship with the EU that attracts foreign investors. After all, as the paper also makes clear, they have a choice where to invest. It does not have to be the UK.
(この意味では、この要望書は、国民投票キャンペーンで展開されたゼロサムの政治的議論ー’欧州の一部’か’欧州以外の世界各国との自由貿易’かーから、貿易や投資の関係に係る議論のレベルを高めるものである。日本は、非常にはっきりと、どちらかを選ぶ選択ではない、と言っている。もしイギリスが世界で最大最強の経済の一つであり続けるならば、外国投資家を惹き付けるイギリスとEUとの関係を持っているであろう。結局、要望書がこれまた明確にしているように、どこに投資するかの選択の自由があるということである。イギリスへ投資しなければならない、ということではない。)

参考
Japan’s Message to the United Kingdom and the European Union (PDF)
英国及びEUへの日本からのメッセージ(PDF、日本語)

ツイッター paper.li Vol.5

All the below links are in English.

弊社ツイッターアカウントの一つ @WSjp_insight のRTによる paper.li 掲載記事5件を貼っておきます。

Why You Should Go Glamping in Slovenia | @voguemagazine @jenrunsworld

Adidas will open an automated, robot-staffed factory next year | @BI_RetailNews

25 Power Words to Drive More Engagement With Your Social Campaigns | @jeffbullas @andrewraso1

Agri is the backbone of NZ economy – over 95% is exported. | @NZTEnews

Irish economic growth of 7.8% tops euro zone again | @RTEbusiness

Ireland アイルランド Vol.4

アイルランド中央銀行の2016年第1四半期レポート Quarterly Financial Accounts Q1 2016 (18 August 2016): Irish households become the fourth most indebted in Europe | @centralbank_ie 概要・抜粋(abstract/excerpts) です。

[概要abstract]
1. Irish households fell from being the third most indebted in the European Union to the fourth most indebted during Q1 2016. This was largely due to the continued reduction in Irish household debt, as well as, further increases in Irish disposable income.
(アイルランド国民の家計は、2016年第1四半期には、EU加盟国中借金が多い3番目から4番目へとなった。可処分所得が一層増えたことと、家計負債が引き続き減ったことが大きい。)
2.Household debt as a proportion of disposable income now stands at 149.4 per cent. That is its lowest level since end-2004.
(可処分所得に対する家計負債は、今、149.4%である。2004年末以来の最低レベルである。)
3. Households net worth increased by 0.3 per cent to reach €628.7bn, or €132,141 per capita. The increase in net worth was largely driven by a rise in housing asset values (€1.7bn), as well as a further decline in household liabilities (€0.9bn).
(家計の純資産は、0.3%増の6287億ユーロ、国民一人あたり132141ユーロに達した。家計負債の更なる9億ドルの減少と、住宅財産価値の17億ドルの上昇による。)
4. NFC debt to GDP declined by 9.8 percentage point over the quarter, falling to €257.3bn. Irish NFC debt has been extremely volatile in recent quarters due to the impact of domiciled MNCs on debt and GDP.
(non-financial corporations 非金融法人の総負債は第1四半期に2573億ユーロとなり、対GDP比率は9.8%減った。アイルランド国内に本社を置く multinational corporations 多国籍企業が総負債やGDPへの影響を持つため、最近のいくつかの四半期において非金融法人の総負債は極端に揺れ動いている。)
Household Debt Cross Country Comparison

[補足・抜粋excerpts]
1. Net Lending/Borrowing of All Sectors (Chart 1.1 関連)
The domestic economy continued to be a net lender to the rest of the world during Q1 2016, as the net borrowing of government and financial corporations was exceeded by deleveraging by households and non-financial corporations…

Net LendingBorrowing Private Sector Debt to GDP

2. Private Sector Debt (Chart 2.1 関連)
… CSO revisions to the National Accounts and International Investment Position… redomiciling of some corporations and corporate restructuring… contributed to significant increases in GDP and NFC debt from 2014 onwards. Private sector debt as a percentage of GDP peaked in Q1 2015 at 400.7 per cent, and has since declined substantially to 315.2 per cent in Q1 2016. … primarily by growth in annualised GDP over the period, but is also reflective of falling private sector debt, which has contracted by 3.7 per cent since Q1 2015. …

3. Household Sector
Household Net Worth Debt Indicators

Chart 3.1 関連
… This was partially offset by a decline in households’ holdings of financial assets (€0.5bm). Compared to a post-crisis low of €454.1bn in Q2 2012, household net worth has risen by 38.5 per cent. However, it is still 12.4 per cent lower than its pre-crisis peak of €718bn in Q2 2007.

Chart 3.2 関連
Household debt continued to decrease during Q1 2016, falling by €1.1bn, or 0.7 per cent, to €148.5bn. This represented a household debt per capita of €31,216. Household debt is at its lowest level since Q1 2006. …

Chart 3.3 関連
Indicators of household debt sustainability continued to improve during Q1 2016. Debt as a proportion of disposable income fell over the quarter, from 152.7 per cent to 149.4 per cent, reflecting both the decline in household debt, as well as strong growth in annualised disposable income. …

Comparison Transactions in Financial Assets Deposit Transactions with MFIsGovernment

Chart 3.4 関連
… Over the year Danish household debt fell significantly more than any other country examined, declining by 23.2 percentage points. In contrast to this, Swedish households saw a 4 percentage point increase over the same period as they climbed to become the third most indebted in the European Union, with a household debt level of 153.5 per cent of disposable income.

Chart 3.5 関連
… The reduction in financial assets over the quarter largely reflected a fall in transactions of insurance technical reserves. … The majority of households’ financial investments over the quarter were in the form of currency & deposits, while shares & other equity experienced positive transactions for the first time since Q4 2013.

Chart 3.6 関連
… This marked the first time since Q4 2013 that household deposit transactions with MFIs (monetary financial institutions) had declined. In contrast, households increased lodgements with government deposit accounts for the first time since Q1 2013.

Chart 3.7 関連
… Over recent quarters net lending has become increasingly driven by higher investment in financial assets, as opposed to deleveraging.

Household Net LendingBorrowing NFC Debt

4. Non-Financial Corporation Sector
Irish NFCs are significantly impacted by the activities of large MNCs. These latest NFC results incorporate the recent annual revisions to the CSO’s International Investment Position (IIP). The revisions include large MNCs which redomiciled to Ireland or moved significant parts of their balance sheets to Ireland during 2014 and 2015. These entities also contributed towards some of the very substantial increase in Irish GDP for 2015.

Chart 4.1 関連
… The decline in debt over the past year largely reflected exchange rate movements. Debt as a percentage of GDP fell from 327.5 per cent in Q1 2015 to 257.3 per cent in Q1 2016. This reflected both falling NFC debt, as well as, substantial GDP growth during 2015.

NFC Debt Comparison Loans AssetsLiabilities

Chart 4.2 関連
… Luxembourg, which also has a lot of large MNCs relative to the size of its economy, had the highest debt at 349 per cent of GDP. … how volatile Irish NFC debt to GDP has been in recent years compared to other euro area countries.

Chart 4.3 関連
… The substantial increase in debt held by non-residents reflects this corporate activity and explains why exchange rate movements have had a significant impact on NFC debt in some quarters. …debt held by Irish residents has been on a downward trend in recent years. …partly reflected NFC deleveraging with Irish MFIs.

Chart 4.4 関連
…largely reflected MNC activities. Net financial assets (financial assets minus liabilities) became even more negative since Q1 2015. This is because some MNCs had large non-financial assets or relocated substantial non-financial assets to Ireland.

ツイッター paper.li Vol.4

All the below links are in English.

弊社ツイッターアカウントの一つ @WSjp_insight のRTによる paper.li 掲載記事7件を貼っておきます。

Irish economic growth | @RTEbusiness

Ireland’s national accounts | @ucddublin @Aidan_Regan

Soon Your Smart Car Will Also Be an Amazon Locker | @BloombergCA @ElisBehrmann @rweiss5

2016 @BSAnews GLOBAL CLOUD COMPUTING SCORECARD (pdf) | @invest_canada

IMF Backs More BOJ Easing If Coupled With Comprehensive Reforms | @business @RichMiller28

Nagasaki, 1945: “The world did not need your experiment” | @jricole

Rio 2016: What Olympic sports taught 8 leaders about successfully running a business | @Inc @JustinJBariso

ツイッター paper.li Vol.3

All the below links are in English.

弊社ツイッターアカウントの一つ @WSjp_insight のRTによるpaper.li掲載記事5件を貼っておきます。

Brexit is already proving to be a huge victory for global free trade | @LSolomonTweets

A chocolate bar from Canada won 1st prize | @RCInet

About Renewable Energy | @NRCan

This year, Oscar speaks with an Irish accent | @BarryODowd_Irl

San Diego to become largest U.S. city to run on 100% renewable energy | @envirojourno @inhabitat

Ireland アイルランド Vol.3

日本・アイルランド間の貿易・投資関連概観です。

1. 日・アイルランド外交関係樹立60周年(2017年)記念の Partnership for Innovation and Growth: Joint Declaration by the Prime Minister of Japan and the Taoiseach of Ireland(「イノベーションと成長のためのパートナーシップ」首脳による共同宣言)[PDF] p.2-4において、
・ 農業・食料、金融サービス、ICT、生命科学、クリーンテクノロジー(agri-food, financial services, ICT, life sciences, clean technologies)などの主要経済分野における投資・貿易を両国相互に増やせる大きな可能性
・ 新しい医療機器・技術(new medical devices and technologies)、再生エネルギーやスマートシティ(renewable energy and ‘smart’ cities)、ICTの高齢者への活用、における両国間の一層緊密な協力
につき述べられています。

ほか参考:
安倍総理大臣のアイルランド訪問(概要と評価) 平成25年6月20日
ケニー・アイルランド首相の訪日 平成25年11月27日
アイルランド(Ireland) 基礎データ 平成28年6月15日
アイルランド概況 [PDF] | JETRO
アイルランド [PDF] | 国際金融情報センター

2. Facts about Ireland Autumn 2015 [PDF] | @IDAIRELAND
p.2に、輸出主要分野(PHARMA & CHEMICALS 28%, COMPUTER SERVICES 22%, BUSINESS SERVICES 12%, FINANCIAL SERVICES 10%, MEDICAL DEVICES 6%, MACHINERY & TRANSPORT 6%, FOOD & BEVERAGE 5%)、
p.8に、調査研究重点分野
が掲載されています。

3. 進出日本企業 2011 [PDF] | JETRO p.7-10 には、
【製薬】アステラス製薬、武田薬品工業、第一三共、小林製薬
【金融】野村ホールディングス、大和証券
【メーカー】アルプス電気、ネリキ、ブラザー工業、日立工機、富士通、レクザム
【その他】ガーラ(オンラインゲーム)
が挙げられています。

4. なお、北アイルランドにつき、あくまで参考:
安倍総理大臣の北アイルランド日系企業関係者等との交流 平成25年6月18日
ノーザンアイルランド 2016年3月 [PDF有] | @InvestNI

ツイッター paper.li Vol.2

All the below links are in English.

弊社ツイッターアカウントの一つ @WSjp_insight のRTによるpaper.li掲載記事5件を貼っておきます。

Canada can transition to renewable energy in just a few decades, says Stanford University professor @mzjacobson | @monique_muise

Irish ANZACS database at @UNSW | @IrelandSydney

@CharlieFlanagan addressed the diplomatic corps on Brexit and the Day of Commemoration | @IrelandEmbUSA

Kenny in hot water for backing Scotland – Scottish Tories angry at Irish intervention | @1johnmacdonald; @CormacMcQuinn @KevDoyle_Indo

Vancouver company @SewageSHARC turns sewage into heat | @CanCGChicago; @jackiewattles