U.S.A. アメリカ Vol.5(PROBLEMS UNSOLVED AND A NATION DIVIDED)

All the below links are in English. Excerpts are on our own.

PROBLEMS UNSOLVED AND A NATION DIVIDED (PDF; September 2016) | @MichaelEPorter, Jan W. Rivkin, @desaimihira, with Manjari Raman – The State of U.S. Competitiveness 2016 Including findings from @HarvardHBS’s 2016 surveys on U.S. competitiveness
抜粋・抄訳です。

EXECUTIVE SUMMARY p.2-5
Key Findings(主な調査結果)
[Chapter 1] The U.S. economy in an era of political paralysis
• Addressing America’s economic challenges requires a common understanding of competitiveness and the true underpinnings of prosperity. We define competitiveness as follows: A nation is competitive to the extent that firms operating there can compete successfully in domestic and international markets while also lifting the living standards of the average citizen. Competitiveness must lead to shared prosperity, in which all Americans have the opportunity to advance economically.
(アメリカの経済的課題に対処するには競争力についての理解を共有し繁栄の基盤を真に増強することが必要である。我々が定義する競争力とは、民間企業が一般市民の生活水準を引き上げつつ国内外の市場で競争に勝てることである。競争力は、全てのアメリカ国民が経済的に前進する機会を持つ、共有された繁栄につながるはずである。)
• U.S. competitiveness has been eroding since well before the Great Recession. America’s economic challenges are structural, not cyclical. The weak recovery reflects the erosion of competitiveness, as well as the inability to take the steps necessary to address growing U.S. weaknesses.
• Our failure to make progress reflects an unrealistic and ineffective national discourse on the reality of the challenges facing the U.S. economy and the steps needed to restore shared prosperity. Business has too often failed to play its part in recent decades, and a flawed U.S. political system has led to an absence of progress in government, especially in Washington.

[Chapter 2] Faltering U.S. economic performance
problemsunsolved-2-1problemsunsolved-2-2problemsunsolved-2-4problemsunsolved-2-6problemsunsolved-2-7problemsunsolved-2-13problemsunsolved-2-14
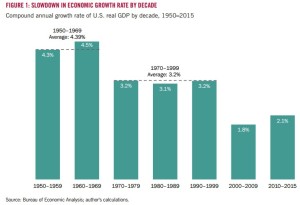
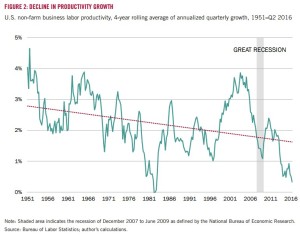
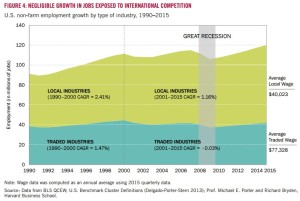
• America’s economic performance peaked in the late 1990s, and erosion in crucial economic indicators such as the rate of economic growth, productivity growth, job growth, and investment began well before the Great Recession.
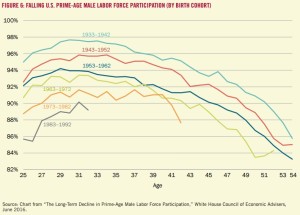
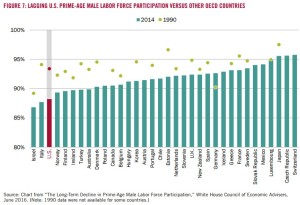
• Workforce participation, the proportion of Americans in the productive workforce, peaked in 1997. With fewer working-age men and women in the workforce, per-capita income for the U.S. is reduced.
(生産的労働力の労働参加は1997年にピークを迎えた。…)
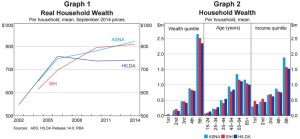
• Median real household income has declined since 1999, with incomes stagnating across virtually all income levels. Despite a welcome jump in 2015, median household income remains below the peak attained in 1999, 17 years ago. Moreover, stagnating income and limited job prospects have disproportionately affected lower-income and lower-skilled Americans, leading inequality to rise.
(実質家計所得の中央値は1999年以来下落し、事実上全ての所得レベルにおいて停滞し続けている。…)
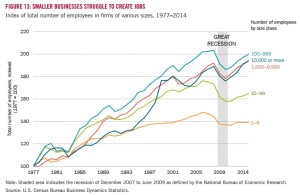
• A similar divergence of performance has also occurred between large companies and small businesses. While large firms have been able to prosper, small companies are struggling, startups are lagging, and small business is no longer the leading job generator.
(… 大企業は繁盛することができたが、中小企業は苦労し、起業者は沈滞し、スモールビジネスはもはや雇用を産み出す牽引役ではなくなっている。)
• Overall prosperity is growing slowly, but the benefits are increasingly not flowing to middle- and lower-income Americans. This puts the American Dream, or the ability of any American to advance and prosper, at risk.

[Chapter 3] An eroding U.S. business environment
problemsunsolved-3-bizenvproblemsunsolved-3-3problemsunsolved-3-4problemsunsolved-3-9
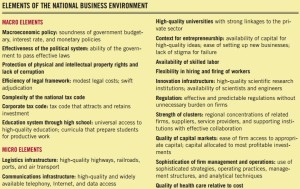
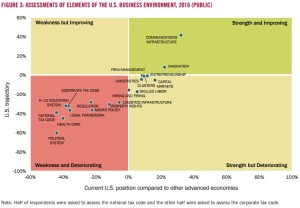
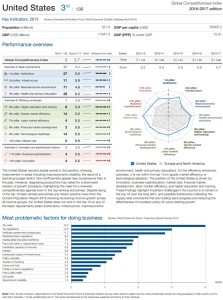
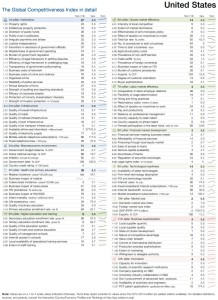
• The U.S. economy retains critical strengths. Business leaders (including HBS students) perceive strengths in areas such as higher education, entrepreneurship, communications infrastructure, innovation, capital markets, strong industry clusters, and sophisticated firm management. However, these strengths are being offset by weaknesses such as the corporate tax code, the K–12 education system, transportation infrastructure, the health care system, and the U.S. political system. Skills have also been eroding and becoming a weakness. Many of the greatest weaknesses are in areas driven by federal policy.
(アメリカ経済は決定的な強みを維持している。… しかし、…弱みに相殺されつつある。スキルも衰え弱みになってきた。多くの最大の弱みは、連邦政府の政策により運営されてきた分野のものである。)
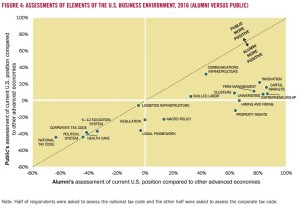
• Alumni working in smaller firms have more negative views of the U.S. business environment than alumni working in larger firms. Members of the general public see the same U.S. competitive weaknesses as HBS alumni but, unlike alumni, perceive far fewer strengths.
• This pattern of strengths and weaknesses helps explain why the U.S. economy is no longer delivering shared prosperity. Large companies, the skilled individuals who run them, and those who invest in them benefit from America’s greatest strengths and are prospering. However, workers and small businesses are captives of the nation’s major weaknesses.
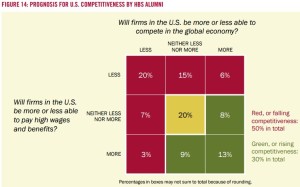
• Pessimism about the trajectory of U.S. competitiveness deepened in 2016, for the first time since we started surveying alumni in 2011. Fifty percent of the business leaders surveyed expect U.S. competitiveness to decline in the coming three years, while 30% foresee improvement and 20% see no change.
• Business leaders and the general public are particularly concerned about the future of American workers: respondents who expect lower pay and fewer employment opportunities for the average American in the future far outnumber those who expect improving worker outcomes.
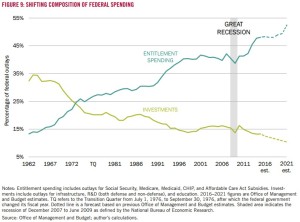
• Inadequate investment in those parts of the business environment on which middle-class Americans depend (areas like K–12 education and skills), together with lack of policy improvement in areas on which small businesses depend (tax policy, regulations, infrastructure), have undermined overall productivity and shared prosperity.

[Chapter 4] The pressing need for a national economic strategy
• Given the significant challenges facing the American economy, the U.S. needs a national economic strategy more than at any other time in recent history. A strategy is an integrated set of priorities that builds on strengths while acknowledging and tackling weaknesses. It identifies the sequence of steps needed to best move ahead.
• The U.S. lacks an economic strategy, especially at the federal level. The implicit strategy has been to trust the Federal Reserve to solve our problems through monetary policy.
(アメリカには、経済政策、とりわけ連邦レベルのものが欠けている。暗示されている戦略は、連銀が金融政策によって問題を解決してくれるのを信頼することであった。)
• A national economic strategy for the U.S. will require action by business, state and local governments, and the federal government. All three levels have a crucial role to play in restoring competitiveness.
• Taking leadership in improving U.S. competitiveness is a pressing imperative for business leaders. Many companies have failed to invest enough in improving the business environments in the regions in which they operate. Companies can have a major impact on restoring U.S. competitiveness through internal steps such as training and improving opportunities and compensation for lower-income employees. Companies must also step up their role to enhance the business environment in their communities by investing in workforce skills, supporting public education, restoring a local supplier base, and participating in collaborative economic development programs in their regions. We find growing evidence that company attitudes toward investing in competitiveness are improving and this is a welcome development. There are more and more innovative programs underway by business in skills, education, and other areas critical to competitiveness.
(アメリカの競争力を回復させるのにリーダーシップを発揮することは、ビジネスリーダーにとって緊近の責務である。多くの会社は、自分達の事業分野におけるビジネス環境への投資を十分にできていない。会社は、低所得従業員への訓練や機会・手当の改善のような社内対策を通してアメリカの競争力を回復させるのに大きな影響力を持つことができる。…)
• State and local governments must also play a crucial role in improving the business environment, because many of the crucial drivers of competitiveness are local. States and cities need a clear strategy for competitiveness rather than isolated initiatives, and government leaders should foster cross-sector collaborations among local business leaders and other community stakeholders.
(競争力の決定的な推進者の多くは地域に根差しているので、州と市等政府もビジネス環境を改善するのに決定的な役割を担わなければならない。…)
• At the state and local level, the Project has found many examples of innovative steps to enhance competitiveness. Mayors, governors, nonprofit leaders, educators, and businesses are working together in new ways to build workforce skills, invigorate the local education system, upgrade infrastructure, improve the entrepreneurial ecosystem, and develop regional economic strategies. Cities and states across America are moving forward toward competitiveness, but more can be done and best practices need to be shared.
(… 市長、知事、非営利団体リーダー、教育者、ビジネスは、労働力のスキルを創り上げ、地域の教育システムを活気付け、起業的なエコシステムを改善し地方の経済戦略を策定する新しい手法において協働している。…)

[Chapter 5] An economic strategy for Washington
problemsunsolved-5-1problemsunsolved-5-3problemsunsolved-5-4problemsunsolved-5-5
• Efforts by business and state and local government to restore competitiveness cannot deliver their full promise if the federal government does not act. Many of the major weaknesses facing the U.S. are in areas controlled by the federal government.
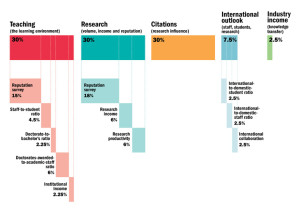
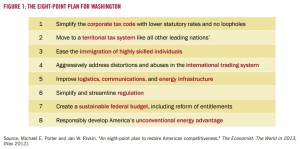
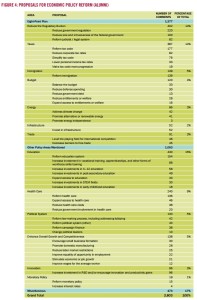
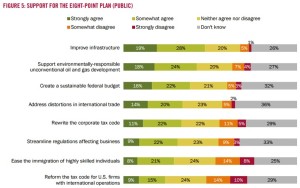
• In 2012, we put forward an Eight-Point Plan of federal policy priorities that would unlock U.S. economic growth and competitiveness. The Eight-Point Plan consists of the following policy recommendations: simplify the corporate tax code with lower statutory rates and no loopholes; move to a territorial tax system like all other leading nations’; ease the immigration of highly-skilled individuals; aggressively address distortions and abuses in the international trading system; improve logistics, communications, and energy infrastructure; simplify and streamline regulation; create a sustainable federal budget, including reform of entitlements; and responsibly develop America’s unconventional energy advantage.
(アメリカの経済成長や競争力の停滞を解き放つ連邦レベルの重点政策であるエイトポイント・プランを、我々は2012年に策定した。税率を下げ抜け穴もなくす法人税法の簡素化、他の主要国同様の源泉地国課税への移行、高度移住者の移入手続の簡素化、国際貿易における歪みや濫用への積極的な対処、物流・通信・エネルギーのインフラ拡充、規制の簡易化・合理化、福祉改革を含む持続可能な連邦政府予算の作成、アメリカのこれまでにないエネルギー優位を責任を持って創り出すこと、を提言している。)
• Each of these areas represents compelling U.S. weaknesses, primarily controlled by the federal government, that can have the most significant and near-term impact on the U.S. economy. There is also wide consensus on the policy change needed to make progress in each area. There are two other crucial U.S. weaknesses, public education and health care, but these are in fields controlled heavily at the state and local levels with no clear consensus yet on solutions.
(それぞれの分野は、アメリカの反論できないほどの弱みを表している。その弱みは、主に連邦政府に権限が握られているものであって、アメリカ経済にとって最も重要かつ近々に影響のあるものであった。また、各分野において進展させるための政策変更をしても構わないというコンセンサスがある。他に二つ、アメリカの決定的な弱みがあり、公共教育とヘルスケアである。しかし、これらは州と市等に大半の権限があるものであり、対処に係る明確なコンセンサスは無い。)
• Progress on even some of these eight priorities would transform the trajectory of the U.S. economy and the economic prospects of all Americans.
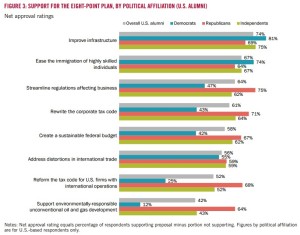
• A strong majority of HBS alumni and HBS students support all eight priorities, with consensus across all political affiliations. When asked in open-ended questions about which priorities alumni felt were most important for federal economic policy, alumni identify virtually the same priorities as those in the Eight-Point Plan. Alumni also mention education, health care, and the political system.
• In the general public survey, there was net positive support for seven of the eight priorities, with a tie on territorial taxes. Public support tended to be somewhat weaker, reflecting the fact that many in the public could neither agree nor disagree, or did not know, whether the eight priorities were good or bad for the economy. Divisive political rhetoric and an uninformed national debate have confused the average American about what the country needs to do to restore the economy. This confusion is a serious obstacle to America’s ability to make progress.
• Despite strong bipartisan support in business and net public support for the Eight-Point Plan, Washington has made very little or no progress on any of these federal economic priorities for well over a decade. The current presidential election is showing no signs of advancing a coherent plan to address these areas.

[Chapter 6] Achieving tax reform
problemsunsolved-6-1problemsunsolved-6-2
• We believe tax reform is the single area with the greatest potential for immediate impact on the economy and is long overdue given changes in the global economy. Corporate tax policy has become a key obstacle to U.S. competitiveness and economic growth, and reforming both corporate and personal taxation is essential to achieving a sustainable federal budget.
(税制が直ちに経済に最大の可能性をもたらす唯一の分野である、世界経済の変化の下で長年の懸案である、と我々は信じている。法人税政策は、アメリカの競争力及び経済成長に対する主な障害となっている。法人税制及び個人税制の改革は、持続的な連邦政府予算の実現にとって必須である。)
• Good tax policy should be guided by the goals of increasing economic efficiency, achieving greater equity, and reducing complexity. The forces of globalization have amplified the inefficiencies and complexities of the current tax system and demand that reform make the U.S. less of an outlier in key tax policy areas – particularly corporate tax policy. Efforts to reduce the negative effects of globalization should be focused on improving competitiveness, for instance, by upgrading the skills of workers threatened by offshoring, rather than on ill-targeted tax policies.
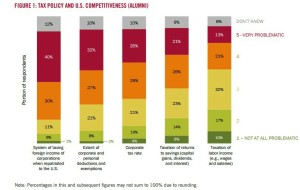
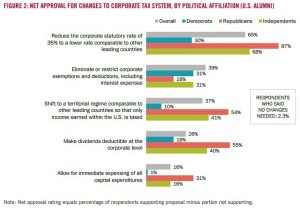
• The top corporate tax problems, according to the surveyed business leaders, are the high corporate tax rate and the taxation of international income. Business leaders report overwhelming and bipartisan support (over 95%) for corporate tax reform. Consensus corporate tax reforms include reducing the statutory rate by at least 10 percentage points, moving to a territorial tax regime, and limiting the tax-free treatment of pass-through entities for business income. The transition to a territorial regime should be complete, not half-hearted via the inclusion of an alternative minimum tax on foreign income. The feasibility of corporate tax reform is promising given the broad consensus on the nature of the problem and the required direction for reform.
(ビジネスリーダーへの調査結果によると、法人税制の一番の問題は、税率の高さと、国際的収入への課税である。法人税制改革には、圧倒的多数かつ超党派で(95%超)の支持が集まっている。法定税率を少なくとも10%下げること、源泉地国課税へと移行すること、パス・スルー法人の事業収入への免税措置を限定すること、などである。…)
• Comprehensive reform of personal taxes will be more challenging. There is less support for many types of personal tax reform. However, there is broad support for instituting a minimum tax on incomes above $1,000,000. Increasing the tax rate on savings; eliminating the deductibility of charitable giving, state and local taxes, and mortgage interest; and taxing employer-provided health insurance did not receive majority support. Respondents support limitations on deductions and exemptions in general but react strongly against them when specific examples are provided.
(個人税制の包括的改革は、もっと困難であろう。多種ある個人税制の改革には、法人税制へほどは支持が無い。しかし、100万ドル以上の所得には最低限の税を課すことには幅広い支持がある。預貯金への税率を上げること、慈善事業への寄付や州市等税さらには抵当金利への税控除を削減すること、雇用主による健康保険へ課税すること、は多数の支持を得なかった。回答者は、税控除や免除を制限することには総論賛成であったが、各論には強い反応があった。)
• Carbon, not consumption, taxes are the best step forward. Carbon taxes are remarkably popular both as a separate revenue raiser and as part of a structural, revenue-neutral reform. In contrast, consumption taxes are quite unpopular and elicit the most spirited commentary, positive and negative, from our alumni. Several recently-proposed new ideas also receive support, including taxing non-C corporation business income, raising the cap on income subject to the payroll tax, and allowing for the deductibility of dividends at the corporate level.
• HBS alumni also strongly support spending reductions as a means to fiscal stability. Nearly one-third chose not only reduced spending, but also reduced taxation. MBA students are much more accepting of tax increases and less supportive of spending cuts.
• To achieve the right kinds of tax reform, leaders must begin to speak more realistically about the fiscal realities America faces. In addition, simplistic, polarizing, and protectionist rhetoric must be avoided. The time for tax reform is long overdue.
• Tax reform can also contribute directly to shared prosperity. The earned income tax credit (EITC) is probably the single most important innovation on the personal tax side over the last two decades. Simplification and expansion of the EITC is a promising direction for reform.

[Chapter 7] A failing political system
problemsunsolved-7-3problemsunsolved-7-78problemsunsolved-7-11
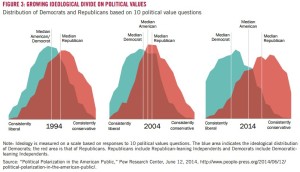
• The U.S. political system was once the envy of many nations. Over the last two decades, however, it has become our greatest liability. Americans no longer trust their political leaders, and political polarization has increased dramatically. Americans are increasingly frustrated with the U.S. political system. Independents now account for 42% of Americans, a greater percentage than that of either major party.
(アメリカの政治システムは、以前は多くの国からの羨望の的だった。しかし、過去二十年以上、アメリカ最大の負の財産となった。アメリカ人はもはや自分達の政治リーダーを信じず、政治の二極化は劇的に増大した。…)
• The political system is no longer delivering good results for the average American. Numerous indicators point to failure to compromise and deliver practical solutions to the nation’s problems. Political polarization has especially made it harder to build consensus on sensible economic policies that address key U.S. weaknesses. It is at the root of our inability to progress on the consensus Eight-Point Plan.
(政治システムは、もはや普通のアメリカ人には良い結果をもたらさない。無数の指標が示すとおり、妥協の失敗、国の問題への実際的な解決策を提供できていない失敗、がある。政治の二極化は、アメリカの主要な弱みに取り組む賢明な経済政策に係るコンセンサスを形成するのを特に難しくしている。…)
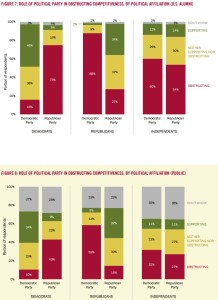
• A large majority of HBS alumni believe the political system is obstructing U.S. economic growth and competitiveness. Many alumni who self-identified as Democrat or Republican blame the other party, but a sizable proportion also hold their own party responsible.
(…政治システムがアメリカの経済成長や競争力を妨害している。…民主党員か共和党員かを自己表明していると他党を責めるが、大きな割合の者達が自党に責任があるとも考えている。)
• Among the general public, many believe that the political system is obstructing economic progress. However, many Americans are unsure, which we attribute to the divisive and partisan dialog on the economy which has confused the public on many issues.
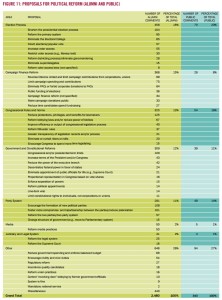
• There is strong support for political reform among surveyed alumni. Of six common proposals for political system reform, a strong majority of HBS alumni support five. The most supported reforms are gerrymandering reform and campaign finance reform.
• Among the general public, the top two political reforms supported are term limits for the House and Senate and campaign finance reform. However, a large percentage of the general public are unsure about which reforms they favor.
• Overall, we believe that dysfunction in America’s political system is now the single most important challenge to U.S. economic progress. Many Americans are keenly aware that the system is broken, but are unsure why it is broken or how to fix it. While there is rising frustration with politics, there is, as yet, no framework for understanding the reasons for today’s poor performance and proposing effective solutions. Identifying such a framework, and the set of reforms that can change the trajectory of our political system, has become a crucial priority.
(… 政治システムが壊れている、と多くのアメリカ人が痛切に感じているが、何故壊れているかどうやって直せるかは分かっていない。政治への不満は高まっているが、今日の貧弱な成果の理由を理解し効果的な解決策を提案する仕組みは無い。…)

日本のガラパゴス症候群 Vol.7(The Global Competitiveness Report 2016–2017 - 国際競争力ランキング2016)

All the below links are in English. Excerpts, et al. are on our own. You can check out methodology as well.

The Global Competitiveness Report 2016–2017 (w PDF) | @wef のPDFのうち、Europe、East Asia and Pacific、North Americaに係る掲載文の抜粋等です。一番最後の私見もご覧ください。

Europe
box5-brexit
Faced with impending Brexit and geopolitical crises spilling over into the region, Europe finds itself in critical condition in many respects. Nevertheless, the region — which includes the EU28, Iceland, Norway, Switzerland, the Balkans, and Turkey — still performs above the global average in terms of competitiveness (4.72 average score in Europe versus an average score of 4.11 among the rest of the world). This is driven by the performance of a group of regional champions, notably Switzerland, which leads the global rankings for the eighth consecutive year. The top 12 includes seven more European countries: the Netherlands (4th), Germany (5th), Sweden (6th), the United Kingdom (7th), Finland (10th), Norway (11th), and Denmark (12th).
uk-p1uk-p2
figure8-europe
… there is wide dispersion in regional performance on several pillars. The largest gap is in the macroeconomic environment pillar, a reflection of the fact that the region has been recovering unevenly from the global financial crisis. Europe’s median performance is weakest across the innovation indicators: Figure 8 shows that the region’s countries are clearly divided, with a significant gap between the innovation assessment for Northern and Western European countries versus Central, Eastern, and Southern European ones. Although this gap has been a persistent challenge, there are some recent encouraging signs of convergence in certain dimensions.
ireland-p1ireland-p2
Accelerating innovation efforts will be crucial to maintain current levels of prosperity, and Europe can expect high returns from focusing its resources on nurturing its talent. … On attracting and retaining international talent, although one European country (Switzerland) achieves the top global scores, the average for the region as a whole is low; this does not bode well for the creation of a vibrant European knowledge economy. The United Kingdom is currently still the most attractive EU destination for talent, yet the Brexit vote has created significant uncertainty over the conditions under which workers from EU countries will be able to participate in the UK economy in the future. Moreover, university applications from the European Union could potentially drop amid uncertainty over prospective students’ status and subsequent access to the UK job market (see Box 5 on the potential implications of Brexit; note that data presented in the Report were collected before the Brexit vote). … some of the largest score drops for France compared to last year were registered for the “attract and retain talent” indicators.
… Yet good practice examples in this area exist on the continent, with countries such as Switzerland and Denmark striking a balance between high labor market flexibility and strong social safety nets. …

East Asia and Pacific
japan-p1japan-p2
East Asia and Pacific is characterized by great diversity. The region’s 18 economies covered in the GCI 2016–2017 span a large part of the development ladder, from Cambodia to Singapore, and include three of the world’s 10 largest economies: China, Japan, and Indonesia. The region’s emerging economies, led by China, have been supporting the modest global recovery since the global financial crisis. These economies accounted for almost two-fifths of global growth last year, more than twice the combined contribution of all other emerging regions. Today, global economic prospects look less favorable as a result of China’s slowdown, anemic growth in Japan and other advanced economies, and persistently low commodity prices undermining the growth and public finances of several economies in the region — notably Indonesia and Mongolia.
nz-p1nz-p2
The GCI results reveal contrasts in the region. Its advanced economies continue to perform strongly. Led by Singapore, 2nd overall behind Switzerland for the sixth consecutive year, these economies all feature in the top 30 of the GCI rankings. Losing ground since last year, Japan ranks 8th (down two) and Hong Kong SAR ranks 9th (down two). New Zealand advances three positions to 13th, while Chinese Taipei is up one notch to 14th. Further down, Australia (22nd) and the Republic of Korea (26th) both improve their scores but their positions are unchanged.
Among emerging economies, Malaysia (25th) continues to lead the region, despite losing some ground this year following six years of improvement. China remains steady at 28th for the third year in a row.
australia-p1australia-p2
Reflected in the evolution of the GCI score since the 2007–2008 edition, the overall competitiveness trends for the region are overwhelmingly positive: 13 of the region’s 15 economies covered since 2007 achieve a higher score today, with Cambodia, China, and the Philippines posting the largest gains (see Figure 11). The only exceptions are Korea and Thailand, though for the latter the loss has been small and from a high base. …
figure11-easiapacific
The region’s advanced economies need to further develop their innovation capacity. Japan and Singapore are the only economies in the region among the world’s top 10 innovators, ranking respectively 8th and 9th in the innovation pillar. Japan, Korea (which has dropped from 8th to 20th in the pillar since 2007), and to a lesser extent Chinese Taipei (11th), have experienced a steady erosion of their innovation edge since 2007. Meanwhile New Zealand (23rd), although it has improved significantly since 2007, Australia (26th), and Hong Kong (27th) remain far behind the world’s innovation powerhouses.
Since 2007, most emerging economies have improved on the basic drivers of competitiveness (i.e., on the first four pillars of the GCI) — often markedly, though also often from a low base. With the exception of Malaysia and Thailand, these economies have made major strides in improving governance, including in tackling corruption. All of them except Thailand have also made significant progress in terms of transport infrastructure… A similar generalized upward trend is seen in health and basic education. … On the macroeconomic front, the situation has also improved almost everywhere, with inflation at a 10-year low in most economies. The fiscal situation is also relatively sound, with most economies posting deficits lower than 3 percent. The notable exception is Mongolia, where the macroeconomic situation remains worryingly volatile. …

North America
figure16-namerica
The United States ranks 3rd for the third consecutive year, while Canada ranks 15th. However, the evolution of how the two countries rank on various pillars sheds light on the forces shaping competitiveness among advanced economies at the forefront of the Fourth Industrial Revolution.
canada-p1canada-p2
Both the United States and Canada outperform the Organisation for Economic Co-operation and Development (OECD) country average overall and on most pillars, although the OECD average beats the United States in areas such as macroeconomic performance and health and primary education (Figure 16). The United States lags behind Canada in the quality of institutions, macroeconomic environment, and health and primary education. Canada’s largest disparities with OECD countries are in business sophistication and innovation. The large domestic market in the United States represents a major source of competitiveness advantage over other advanced economies.
us-p1us-p2
Since 2007, the United States has been falling behind both in absolute and relative terms in infrastructure, macroeconomic environment, and goods market efficiency. It has improved, however, on health and primary education, higher education and training, and especially technological readiness, one of the most essential pillars for taking advantage of new technologies.
Canada, on the other hand, has improved marginally in all efficiency enhancers, with markets for goods, labor, capital, and human capital remaining among the best-ranked of the OECD countries. However, Canada lags behind on innovation and business sophistication, which are especially central for advanced economies.
In the United States, innovation and business sophistication have improved; in Canada, they have deteriorated and could be slowing down productivity improvements. However, the business community in the United States is increasingly concerned about basic determinants of competitiveness such as infrastructure.

私見:ランク自体に一喜一憂するのは無意味ですが、ご指摘のとおりという面もあると感じます。日本の課題は、1st pillar: Institutions(ランク16位、スコア5.4)、3rd pillar: Macroeconomic environment(104位、4.1)、5th pillar: Higher education and training(23位、5.4)、6th pillar: Goods market efficiency(16位、5.2)、7th pillar: Labor market efficiency(19位、4.8)、8th pillar: Financial market development(17位、4.9)、9th pillar: Technological readiness(19位、5.8)に共通して、技術の発展、国内外の経済の連動性、資本主義・民主主義下での経済活動の積み重ねなどにより表れる時代背景に合わない、無駄な作業の多さ、効率の悪さ、機会の不平等、形式主義などを社会慣行・固定観念として引きずってしまっていることではないかと感じています。『日本のガラパゴス症候群』と若干激しいタイトルを付けたのも、この感触に基づきます。公債残高はすぐにはどうしようもないので 3rd pillar は今後も低迷し続け総合ランクにも負の影響を与え続けますが、efficiency や fundamental human rights さらには public welfare を総合考量的に尊重する方向に行けば、各pillarのスコアは上がり日本企業は強くなり日本国民の満足度は増して行くと考えます。ここ何年か同じ顔ぶれの、スイス(総合ランク1位)、シンガポール(2位)、アメリカ(3位)などが参考になるはずです。

日本のガラパゴス症候群 Vol.6(TimesHigherEducation World University Rankings 2016-2017 -THE世界大学ランキング2016)

The below three links (1.~3.) are in English.

the-world-university-rankings-2016-2017-methodology-small

以下、英語抜粋等です。日本人が英語圏の大学や研究機関に人的に入り込めれば、研究は評価され順位は上がる等となります。アジア何位かは考えず、日本が持っている素晴らしい研究成果をいかに評価させるかに執念を燃やし、どんどん人的に英語圏に入っていくことに弊社も微力ながらお手伝いできると考えております。4.は日本語です。

1.  World University Rankings 2016-2017: results announced (September 21, 2016) | @elliebothwell @THEworldunirank @timeshighered

… Overall, 289 Asian universities from 24 countries make the overall list of 980 institutions and an elite group of 19 are in the top 200, up from 15 last year.

When analysing which countries achieve the highest average scores, Singapore comes top on all five of the pillars underlying the ranking – teaching, research, citations, industry income and international outlook. Hong Kong is second for teaching, third for research and fourth for citations.

Rajika Bhandari, deputy vice-president of research and evaluation at the Institute of International Education and co-editor of the book Asia: The Next Higher Education Superpower?, said that the “sharp rise” of Asia’s universities is due to three main factors: rapidly growing populations and demand for higher education in the region; governments making “significant investments” in universities; and improvements by individual institutions.

On advances at university level, she said that many Asian scholars who studied at Western universities are now academics in their home countries and have “really begun to transform their own higher education sectors”.

They have “brought back to [their] home campuses some of the teaching values of critical thinking and liberal education, as well as the idea of promotion based on merit and research outputs”, she said.

She predicted that there will be continued expansion of cross-degree and campus partnerships among institutions in Asia and the West, as well as a “huge push towards intra-regional higher education partnerships and mobility within the Asia-Pacific region”.

However, Richard Robison, emeritus professor in the Asia Research Centre at Murdoch University (@MurdochUni), said while there are a “small number” of Asian universities “making international strides”, many are much further behind.

When asked whether he envisioned some Asian universities competing with the likes of Oxbridge and the Ivy League, he said: “I can’t see them becoming giant intellectual hubs that some big Western universities have become over a couple of hundred years because they have a different idea about education and a different way of going about it.”

He said that Asian universities create a “very pressured environment”, have “a lot of learning by rote” and there is “not a lot of discussion in classes”.

I don’t know if that would translate globally, except in some of the narrow scientific and technical areas,” he said.

2.  World University Rankings 2016-2017: Standing still is not an option (September 21, 2016) | @phil_baty @THEworldunirank @timeshighered

… In 2004, our ability to support the higher education community advanced when we became one of the world’s first organisations to publish a global university ranking. …

In 2010, our world rankings were dramatically enhanced when, after almost a year of open consultation with the global community, we delivered a much more comprehensive version of the THE World University Rankings. We employed for the first time our current balanced range of 13 performance indicators, introducing new metrics for teaching and knowledge transfer in addition to research excellence. …

The Times Higher Education World University Rankings 2016-17 – our 13th annual publication – lists 980 institutions from 79 countries. Last year, we ranked 801 universities from 70 countries, up from only 400 universities in 2014. This year, we were able to draw on a database with tens of thousands of data points on 1,313 of the world’s leading research-intensive universities, compared with the previous year’s total of 1,128 institutions.

This year, we can draw on more than 20,000 responses to our annual academic reputation surveys – 10,323 responses, from 133 countries, to the 2016 survey combined with the 10,507 from last year. This year, through our partner Elsevier (@ElsevierNews), we are also able to examine 56 million citations to 11.9 million publications published over the five years to 2015. Last year, we examined 51 million citations from 11.3 million publications.

Although the overall rankings methodology is the same as last year – we have further enhanced the analysis this time by including books among the research outputs we evaluate, in addition to journal articles, reviews and conference proceedings. Some 528,000 books and book chapters are included for the first time, giving a richer picture of the global research environment.

This year, in another pioneering move, our calculations have been audited by PricewaterhouseCoopers (@PwC_LLP). …

3.  World University Rankings 2016-2017 methodology (September 5, 2016) | @THEworldunirank @timeshighered

… The performance indicators are grouped into five areas:

  • Teaching (the learning environment)
  • Research (volume, income and reputation)
  • Citations (research influence)
  • International outlook (staff, students and research)
  • Industry income (knowledge transfer)

Data collection
Institutions provide and sign off their institutional data for use in the rankings. On the rare occasions when a particular data point is not provided we enter a low estimate between the average value of the indicators and the lowest value reported: the 25th percentile of the other indicators. By doing this, we avoid penalising an institution too harshly with a “zero” value for data that it overlooks or does not provide, but we do not reward it for withholding them.

Getting to the final result
… For all indicators except for the Academic Reputation Survey we calculate the cumulative probability function using a version of Z-scoring. The distribution of the data in the Academic Reputation Survey requires us to add an exponential component.

Teaching (the learning environment): 30%

  • Reputation survey: 15%
  • Staff-to-student ratio: 4.5%
  • Doctorate-to-bachelor’s ratio: 2.25%
  • Doctorates-awarded- to-academic-staff ratio: 6%
  • Institutional income: 2.25%

Research (volume, income and reputation): 30%

  • Reputation survey: 18%
  • Research income: 6%
  • Research productivity: 6%

Citations (research influence): 30%

Our research influence indicator looks at universities’ role in spreading new knowledge and ideas.

We examine research influence by capturing the number of times a university’s published work is cited by scholars globally. This year, our bibliometric data supplier Elsevier examined more than 56 million citations to 11.9 million journal articles, conference proceedings and books and book chapters published over five years. The data include the 23,000 academic journals indexed by Elsevier’s Scopus database and all indexed publications between 2011 and 2015. Citations to these publications made in the six years from 2011 to 2016 are also collected. …

International outlook (staff, students, research): 7.5%

  • International-to-domestic-student ratio: 2.5%
  • International-to-domestic-staff ratio: 2.5%
  • International collaboration: 2.5%

Industry income (knowledge transfer): 2.5%

A university’s ability to help industry with innovations, inventions and consultancy has become a core mission of the contemporary global academy. This category seeks to capture such knowledge-transfer activity by looking at how much research income an institution earns from industry (adjusted for PPP), scaled against the number of academic staff it employs. …

4.  THE世界大学ランキング2016 (2016年9月22日) | @ReseMom (Japanese)

「教育」「研究」「論文被引用数」「産業界からの収入」「国際性」を評価する13の指標をもとに各大学をランク付け・・・

ツイッター paper.li Vol.7

All the below links are in English.

弊社ツイッターアカウントの一つ @WSjp_insight のRTによる paper.li 掲載記事6件を貼っておきます。

Seattle’s Icicle Seafoods to be sold to Canadian aquaculture giant | @seattletimes

WSjp Australia Vol.4: @RBAInfo Bulletin June Quarter 2016 – Household Wealth, Manufacturing

Australia has moved 1.5 metres in 20 years and GPS can’t keep up | @keithbreene @wef

Melbourne researchers say they’ve developed a method of growing & implanting cornea cells | @abcnewsMelb

Why London won’t lose its crown as Europe’s financial capital | @CapX

Foreign Direct Investment (FDI) in the United States | @SelectUSA

U.K. イギリス Vol.9(Brexit Vol.8: Japan’s Message to UK & EU 日本要望書)

(The below two links are in English, and the last one in Japanese.)

さて、当サイトでも今後、随時、Brexit につき情報をアップして参ります。
本日は、@ChathamHouse 関係の記事 Japan Lays Out a Guide to Brexit (6 September 2016) | Sir David Warren @CHAsiaProg(’日本がイギリスEU離脱の手引きを示す’)本文と抄訳をご紹介します。

– Britain would do well to embrace Tokyo’s constructive criticism as it prepares for life outside the EU.(EU域外での生き方を準備している日本の建設的な批判を、イギリスは包み込んで受け容れてうまくやっていける)

The Japanese government paper on the implications of Brexit released on 2 September has been described in the UK media as an ‘unprecedented’ and ‘dire’ warning, a ‘stark’ threat, and dismissed as ‘doom-mongering’. In reality, it is a carefully-argued and very detailed analysis of the areas of Brexit-related concern to the thousands of Japanese companies in the UK, and those aspects of the current business environment that they want to preserve in the forthcoming negotiations. Setting out the Japanese stall in this way risks annoying British negotiators with the responsibility of finding their way through the minefield of agreeing the terms of Britain’s divorce from Europe. But the Japanese analysis, used constructively, is an important guide to what really matters in ensuring that a post-Brexit UK is not only ‘open for business’, but a country that the world’s major investors want to do business with.
(9月2日に公表されたイギリスEU離脱に係る日本政府の要望書(下記参考英文)は、’前代未聞’で’切迫した’警告であり’正真正銘’の脅しであるとイギリスのメディアでは伝えられており、’恐怖を利用した’と切り捨てられている。しかし、日本の要望書は、イギリスEU離脱に係るイギリス国内の千単位の日本企業にとっての懸念について、また、今後の離脱交渉において日本企業にとって維持されたい現在の企業活動環境について、注意深く議論されまた非常に詳細に分析したものである。… 建設的に使えば、離脱後のイギリスが’企業活動にとって動き易い’のみならず世界の主な投資者が企業活動をしたい国であることを確保するのに真に問題となる事柄についての重要な手引きである。)

The paper is couched in terms of cooperation and partnership. Japanese inward investment into the UK has been one of the major industrial success stories of the last 40 years, with the 1984 decision of Nissan to build its car plant at Sunderland the turning point. The Japanese government and Japanese companies want to preserve this post-Brexit. But that means keeping radical changes to the current environment that might emerge from the Brexit talks to a minimum. Specifically, the Japanese want, among other things, to maintain current tariff rates and customs procedures, access to skills (including from within the EU), the current provision of financial services (50 per cent of the value of British manufactured goods is accounted for by services), the current arrangements for information protection and data exchange, unified intellectual property protection, harmonized standards and regulations, and access to the EU R&D budget and joint programmes. These requests are aimed at EU negotiators as well as at the UK. A 10-page annex goes into even more detail, sector by sector.
(… とりわけ日本が望むのは、関税率、税関手続き、EU域内も含めた人材へのアクセス、金融サービス条項、情報保護及び… →下記参考(日本語PDF3頁等)をご覧ください

The context of these requests is not just concern about Brexit. The paper makes clear that leading the free-trade system remains a responsibility shared by Japan, the UK and the EU. The Japanese government are nervously watching the US presidential election, with Donald Trump openly adopting a protectionist line and Hillary Clinton now opposed to the Trans-Pacific Partnership (TPP) trade deal; they will also have been concerned at suggestions from European politicians that the US−EU Transatlantic Trade and Investment Partnership (TTIP) may fail. Hence their statement – echoed by President Obama at the G20 in Hangzhou in his remarks on TTIP – that the priority must be to finalize the EU−Japan Economic Partnership Agreement this year. A post-Brexit UK−EU relationship that erects protectionist walls would, in Japan’s view, be a disaster for everyone.  The arguments in the paper are about preserving the health of the global economy.
(要望書はイギリスEU離脱への懸念を示しているだけではない。引き続き自由貿易をリードしていくことが日英欧において共有される責任であることが明確にされている。日本政府はアメリカ大統領選挙を神経質に見守っている。…)

And Japan calls for early clarity and transparency on the difficult issues.  The paper argues that uncertainty causes volatility, and warns against the negotiating process producing ‘unpleasant surprises’. This advice may be unwelcome to UK politicians and negotiators who have to work out how to trade off being part of the single market with the need to restrict freedom of movement.   This is a political dilemma that needs to be unravelled slowly; Britain’s economic partners’ need for early clarity runs directly counter to the politics which Prime Minister Theresa May and her cabinet have to manage over the coming months.
(そして日本は、難しい案件につき早期の明確化及び透明性を求めている。不確実性が市場の急激な変動を引き起こすと述べ、また、交渉過程が’嬉しくないサプライズ’をもたらすことを警告している。このアドバイスは、単一市場の一部であることと移動の自由を制限することの折り合いをいかに付けるかに尽力せねばならない政治家や交渉者からは、歓迎されないものかもしれない。これは、ゆっくりほどけて行かざるを得ない政治的ジレンマなのであるから。…)

The paper observes that ‘Japan respects the will of the British people as demonstrated in the referendum’ and express confidence that ‘the UK and the EU will overcome . . . difficulties and lay the foundations for the creation of a new Europe’. Nonetheless, the menu of requests is challenging and almost certainly impossible to fulfil in its entirety, if, as the prime minister has said, ‘Brexit means Brexit’. But it is a guide to what foreign businesses, attracted to the UK by successive governments with the promise of being inside the single market in an EU member state committed to further trade liberalization, want from the new arrangements. 
(要望書では、’日本はイギリス国民の投票の意思を尊重する’と述べられ、また … にもかかわらず … しかし、これは、外国企業がイギリスの今後の交渉過程において整えてもらいたいことに係る手引きなのである。…)

In that sense, it should also lift the level of current discussion on trade and investment relations away from the zero-sum political arguments during the referendum campaign – ‘being part of Europe’ versus ‘free trade agreements with the rest of the world’.  Japan is saying, very clearly, that it is not an either/or choice. If the UK is to remain one of the world’s largest and most powerful economies – which, however much it is talked down in Britain, it still is – it is going to have to have a relationship with the EU that attracts foreign investors. After all, as the paper also makes clear, they have a choice where to invest. It does not have to be the UK.
(この意味では、この要望書は、国民投票キャンペーンで展開されたゼロサムの政治的議論ー’欧州の一部’か’欧州以外の世界各国との自由貿易’かーから、貿易や投資の関係に係る議論のレベルを高めるものである。日本は、非常にはっきりと、どちらかを選ぶ選択ではない、と言っている。もしイギリスが世界で最大最強の経済の一つであり続けるならば、外国投資家を惹き付けるイギリスとEUとの関係を持っているであろう。結局、要望書がこれまた明確にしているように、どこに投資するかの選択の自由があるということである。イギリスへ投資しなければならない、ということではない。)

参考
Japan’s Message to the United Kingdom and the European Union (PDF)
英国及びEUへの日本からのメッセージ(PDF、日本語)

Australia オーストラリア Vol.4

(All the below links are in English.)

オーストラリア中央銀行 Reserve Bank of Australia の 2016年第2四半期 Bulletin June Quarter 2016 | @RBAInfo をご紹介します。

1. Household Wealth in Australia: Evidence from the 2014 HILDA Survey | Paul Ryan and Tahlee Stone(オーストラリア国民の家計の財産状態)

[概要abstract]
This article uses data from the Household, Income and Labour Dynamics in Australia (HILDA) Survey* to assess how the distribution of wealth changed for Australian households between 2010 and 2014. Average household wealth increased modestly over that period, driven mainly by growth in the value of financial assets, most notably superannuation. The growth of housing wealth was slow in comparison, particularly in Queensland and Western Australia. While most of the changes in wealth were broadly based across households, wealth increased more rapidly for those residing in New South Wales and for retired households with large holdings of superannuation and equity assets.
(本論文は、オーストラリア家計収入労働関係性HILDA調査のデータを使って、2010年から2014年の間のオーストラリア国民の富の分配の変化を評価している。この期間、主に、金融資産価値、最も知られているものでは退職年金の増加によって、平均的な家計の富は緩やかに増加した。特にクイーンズランド州や西オーストラリア州では伸びは鈍い一方、ニューサウスウェールズ州では急速に伸びた。)
** Australian System of National Accounts (ASNA)
*** Australian Bureau of Statistics (ABS) Survey of Income and Housing (SIH)

[補足・抜粋/excerpts]
Introduction
… As the general distribution of household wealth (i.e. total assets minus total debts) across, these categories is broadly the same in 2014 as it was in 2010, this article focuses on how the distribution of housing assets (including investment properties), non-housing assets (predominately superannuation) and household debt have changed between 2010 and 2014.
The HILDA Survey* data suggest that the average Australian household had total wealth of around $740 000 in 2014. Measures of real (inflation adjusted) wealth per household from the HILDA Survey grew a little less over the decade to 2014 than measures based on household-level data from the SIH*** and distributional wealth indicators from the ABS that are consistent with aggregate data from the ASNA** (Graph 1).
graph12
Looking at the cross-sectional distribution of household wealth, older and higher-income households tend to have higher levels of wealth (Graph 2). …

Household Wealth
Overall, almost 60 per cent of households in the HILDA Survey had more real wealth in 2014 than was the case in 2010. Households with the lowest levels of wealth in 2010 saw the most growth of wealth over the four years to 2014 (Graph 3). This partly reflects the fact that low-wealth households are generally young and are just starting to build wealth. …
graph3

… most of the increase in wealth over the 2010–14 period came from growth in the value of non-housing assets, which are predominantly financial assets such as superannuation, equities and deposits (Graph 4). …
graph4

… Households in New South Wales and Victoria saw the largest increase in wealth, with growth in both housing and non-housing assets, while households in Queensland and Western Australia saw the biggest decrease in wealth, on average, mainly owing to a fall in the value of housing assets. The other states and territories generally saw relatively little growth in wealth over the period. The outcomes for households in Queensland and Western Australia are likely to have been influenced by the decline in commodity prices and the mining investment boom following the peak, which occurred between 2010 and 2014. …

Housing Assets
Housing is the largest asset class on Australian households’ balance sheets, accounting for around 60 per cent of total assets. Over any given period, growth in housing assets can be due to a change in housing prices or a change in the stock of housing held by Australian households. …Looking more closely across the states reveals large differences in the mean and median values of housing assets (Graph 5). …
graph5

… the share of households that either became home owners for the first time or upgraded their main residence decreased relative to the 2006–10 period (Graph 6). …Households in New South Wales and Victoria were slightly more likely to increase their holdings of other property than was the case from 2006 to 2010.
graph67

Household Debt
… High-income households hold the majority of debt. The top income quintile held almost 50 per cent of the stock of household debt in 2014. Almost a third of households held no debt, with the majority of these being retired households.
Over the four years to 2014, about 40 per cent of households increased their levels of nominal debt, while a similar share of households reduced their holdings of debt (Graph 7). …

Property debt accounted for a little over 80 per cent of the stock of debt held by households in 2014. Average debt increased modestly from 2010 to 2014, by a little more than 2 per cent per year (Graph 8). …
graph89

Non-housing Assets
… The mean value of real non-housing assets increased from around $320,000 in 2010 to almost $400,000 in 2014 (Graph 9). … Wealthier households held a higher-than-average share of assets in the form of direct equity holdings and business assets, while households with lower net wealth held more in cash and deposits, superannuation and durable goods (Graph 9).

The mean superannuation balance grew by around 4 per cent per annum in real terms for all households over the period to $250,000 in 2014 (Graph 10). … The noticeably stronger growth in median superannuation assets relative to the mean for households aged 45 to 64 years suggests that the ‘typical’ (or median) household in these age groups are building up superannuation assets faster in the lead-up to retirement than the households in the same age group with the largest balances of superannuation (Graph 10).
graph10

Conclusion
… The main driver of growth in household wealth over that period was an increase in the value of financial assets, mostly superannuation assets. Weaker growth in housing wealth, with declines in Queensland and Western Australia, contributed to the slower growth in total wealth from 2010–14. …

2. Conditions in the Manufacturing Sector | Sean Langcake(製造業界の現状)

[概要abstract]
Manufacturing output and employment have fallen steadily as a share of the Australian economy for the past three decades. This article looks at the composition of the sector and draws on the Reserve Bank’s liaison with manufacturers to provide an insight into some of their responses to the structural challenges in recent years. According to liaison, the increase in the supply of manufactured goods from low-cost sources abroad, exacerbated by the appreciation of the Australian dollar during the period of rising commodity prices, impaired the viability of many domestic manufacturers and precipitated the closure of some manufacturing production over the past decade. While the recent exchange rate depreciation has helped to improve competitiveness of Australian producers, so far there is only limited evidence of a recovery in manufacturing output and investment.
(オーストラリア経済において、製造業の生産と雇用は、過去三十年着実に低下してきている。ここでは、近年の経済構造の変化への製造業者の対応を洞察する。コモディティ価格上昇期に豪ドル高となったため、低コスト製品が海外から流入し、それがオーストラリア国内製造業者の価値を損ない、過去十年の製造業者閉鎖を促進した。最近の為替レート低下によりオーストラリア製造業者の競争力は改善されている一方、製造業者の生産と投資が回復してきている証拠はまだ限定的である。)

[補足・抜粋/excerpts]
Introduction
… It currently accounts for around 7 per cent of total output and employment. … over the 2000s, strong Asian demand for Australian commodities led to a sharp increase in the terms of trade and an appreciation of the Australian dollar. …

Manufacturing in Australia
Manufacturing output increased steadily throughout most of the 1990s before plateauing in the early 2000s; output today is around the same level it was just over a decade ago (Graph 1). … Over the past two decades, the Australian economy as a whole has grown considerably, resulting in a marked decline in manufacturing output as a share of total output. Employment in manufacturing has also declined over the past two decades, with growth in labour productivity in line with that of the economy as a whole. …
…investment in the manufacturing sector has also fallen steadily since its peak in 2005/06 (Graph 1). …
graph_1

Australia’s manufacturing sector is quite diverse and is comprised of several sub-industries, the largest being: food, beverage & tobacco; machinery & equipment; petroleum, coal & chemicals; and metal products (Graph 2). …
graph_2

The food, beverage & tobacco and metal products sub-industries both rely heavily on inputs from primary industries (agriculture and mining) where Australia has an abundant supply, and use a relatively low share of intermediate components that are imported. …
Conversely, the machinery & equipment and petroleum, coal & chemicals sub-industries use relatively few inputs from primary industries in Australia and have a relatively high share of imported intermediate components. …
table_1

The International Context
Over the past 25 years, most advanced economies have seen their manufacturing sectors recede as a share of both output and employment, although Australia has generally had a lower share than many other advanced economies (Graph 3).
graph_3

The ratio of value added to total production in the Australian manufacturing sector is broadly comparable to that in other advanced economies’ manufacturing industries (Table 2). Relative to other Australian industries, manufacturing is a low value-added sector; the ratio of value-added to total production (29 per cent) is the lowest of any industry. …
table_2

… The steady increase in China’s share of Australia’s merchandise imports has coincided with a fall in the prices of imported manufactured goods relative to domestic production (Graph 4).
graph_4

The Australian Dollar and Implications for Competitiveness
The appreciation of the Australian dollar from 2000 to 2013 worked against the international competitiveness of Australian manufacturing (Graph 4). Exports of Australian manufactured goods grew slowly over this period as they became relatively more expensive overseas (Graph 5). …
graph_5

… Typically, contacts maintain some productive capacity in Australia, either as a testing or research and development (R&D) facility, to protect their more sensitive intellectual property, or to be able to fill orders more quickly. Nevertheless, firms that have ‘offshored’ production typically have much less productive capacity remaining in Australia than their overseas operations. …
…there are significant lags between a depreciation of the dollar and a response in manufacturing production and exports due to the nature of supply chains. For instance, even though domestic producers have become more competitive against imported products, retailers or other manufacturers may have contracts that secure supply in advance, which inhibits their ability to switch to domestically produced products. …
…they responded to the appreciation of the dollar by importing more goods, either by choice or necessity as production of some inputs had moved offshore. … while the lower value of the dollar aids demand, margins are under pressure due to rising import costs in instances where local substitutes are not readily available.

Domestic Input Costs and Implications for International Competitiveness
… Australian manufacturing labour costs appear to be relatively high compared with those in other economies – a feature that has become more pronounced over time (Graph 6). …
graph_67

…firms have been looking to find labour productivity gains by automating some production processes. They have also been developing new products to diversify their offering. These shifts are borne out in the nature of firms’ investments; increasingly, manufacturers are investing in intellectual property rather than physical capital (Graph 7). …

…foreign-owned manufacturing firms operating in Australia are more willing to invest in R&D than physical capital in their Australian subsidiaries, although it is difficult to quantify what share of manufacturing activity is accounted for by these firms. …

Difficulties Integrating in Supply Chains
…other economies have responded to pressure from cheaper, imported manufactured goods by integrating themselves more effectively into increasingly fragmented global supply chains. … Australia’s geographic isolation contributes to high trade costs and presents a significant impediment to greater participation in global supply chains. …the costs of trading Australia’s manufactured goods – largely international transport costs – are in the order of 20–25 per cent higher than the global average. … only 4 per cent of manufacturing firms are part of an integrated supply chain.
…Australia’s relatively high trade costs leave domestic producers primarily exposed to the relatively small domestic market and unable to benefit from the scale advantages that other advanced economies achieve through production for larger domestic markets and export markets. …around 45 per cent of the difference between US and Australian non-farm labour productivity levels can be explained by Australia’s geographic isolation. High trade costs may also protect less productive domestic firms from import competition, although this protection is likely to have been eroded through time by lower international search and transaction costs. …

Conclusion( )内は抄訳
The depreciation of the Australian dollar over recent years has helped to improve the competitiveness of Australian manufacturing. Additionally, there is likely to be a steady level of activity in the food, beverages & tobacco sub-industry due to Australia’s comparative advantage in primary resources and growing export demand. Against this, softer demand from the mining sector and the cessation of passenger vehicle production will weigh on output, although motor vehicle and transport equipment production currently makes up only around 5 per cent of manufacturing output.
(豪ドル安は製造業の競争力を向上させてきた。食品飲料煙草が伸びた反面、鉱業の鈍い伸びや乗客用乗物の製造中止は今後製造に重くのし掛かるであろう。)
In the longer term, the structural challenges facing the Australian manufacturing sector are likely to constrain output. Declining global prices for manufactured goods and the sustained high level of the Australian dollar during the resource investment boom impaired the viability of many Australian manufacturers and precipitated considerable structural change in the sector, with numerous manufacturers either closing or shifting production to lower-cost economies. R&D operations are one area where Australia’s cost disadvantages are less of an impediment and our highly skilled workforce is a comparative advantage. Although R&D investment has been growing steadily, the subsequent demand for labour and, in particular, physical capital are likely to be less than was generated by ‘traditional’ manufacturing activities.
(長期的には、オーストラリア製造業の構造的課題は製造を抑える。製造業の製品の世界的な価格低下と、資源ブームの間高止まりした豪ドルは、オーストラリアの多くの製造業者の生命力を削ぎ、廃業か低コスト国での生産へのシフトにより製造業界の構造変化を早めた。R&Dはオーストラリアのコスト面での不利がさほど問題にならない分野であり、熟練度の高い労働力が比較優位となっている。R&Dへの投資の伸びは堅調であるが、R&Dにおける引き続く労働力の需要ととりわけ物的資本の需要は’伝統的’製造業における需要よりは少なそうである。)

Ireland アイルランド Vol.4

アイルランド中央銀行の2016年第1四半期レポート Quarterly Financial Accounts Q1 2016 (18 August 2016): Irish households become the fourth most indebted in Europe | @centralbank_ie 概要・抜粋(abstract/excerpts) です。

[概要abstract]
1. Irish households fell from being the third most indebted in the European Union to the fourth most indebted during Q1 2016. This was largely due to the continued reduction in Irish household debt, as well as, further increases in Irish disposable income.
(アイルランド国民の家計は、2016年第1四半期には、EU加盟国中借金が多い3番目から4番目へとなった。可処分所得が一層増えたことと、家計負債が引き続き減ったことが大きい。)
2.Household debt as a proportion of disposable income now stands at 149.4 per cent. That is its lowest level since end-2004.
(可処分所得に対する家計負債は、今、149.4%である。2004年末以来の最低レベルである。)
3. Households net worth increased by 0.3 per cent to reach €628.7bn, or €132,141 per capita. The increase in net worth was largely driven by a rise in housing asset values (€1.7bn), as well as a further decline in household liabilities (€0.9bn).
(家計の純資産は、0.3%増の6287億ユーロ、国民一人あたり132141ユーロに達した。家計負債の更なる9億ドルの減少と、住宅財産価値の17億ドルの上昇による。)
4. NFC debt to GDP declined by 9.8 percentage point over the quarter, falling to €257.3bn. Irish NFC debt has been extremely volatile in recent quarters due to the impact of domiciled MNCs on debt and GDP.
(non-financial corporations 非金融法人の総負債は第1四半期に2573億ユーロとなり、対GDP比率は9.8%減った。アイルランド国内に本社を置く multinational corporations 多国籍企業が総負債やGDPへの影響を持つため、最近のいくつかの四半期において非金融法人の総負債は極端に揺れ動いている。)
Household Debt Cross Country Comparison

[補足・抜粋excerpts]
1. Net Lending/Borrowing of All Sectors (Chart 1.1 関連)
The domestic economy continued to be a net lender to the rest of the world during Q1 2016, as the net borrowing of government and financial corporations was exceeded by deleveraging by households and non-financial corporations…

Net LendingBorrowing Private Sector Debt to GDP

2. Private Sector Debt (Chart 2.1 関連)
… CSO revisions to the National Accounts and International Investment Position… redomiciling of some corporations and corporate restructuring… contributed to significant increases in GDP and NFC debt from 2014 onwards. Private sector debt as a percentage of GDP peaked in Q1 2015 at 400.7 per cent, and has since declined substantially to 315.2 per cent in Q1 2016. … primarily by growth in annualised GDP over the period, but is also reflective of falling private sector debt, which has contracted by 3.7 per cent since Q1 2015. …

3. Household Sector
Household Net Worth Debt Indicators

Chart 3.1 関連
… This was partially offset by a decline in households’ holdings of financial assets (€0.5bm). Compared to a post-crisis low of €454.1bn in Q2 2012, household net worth has risen by 38.5 per cent. However, it is still 12.4 per cent lower than its pre-crisis peak of €718bn in Q2 2007.

Chart 3.2 関連
Household debt continued to decrease during Q1 2016, falling by €1.1bn, or 0.7 per cent, to €148.5bn. This represented a household debt per capita of €31,216. Household debt is at its lowest level since Q1 2006. …

Chart 3.3 関連
Indicators of household debt sustainability continued to improve during Q1 2016. Debt as a proportion of disposable income fell over the quarter, from 152.7 per cent to 149.4 per cent, reflecting both the decline in household debt, as well as strong growth in annualised disposable income. …

Comparison Transactions in Financial Assets Deposit Transactions with MFIsGovernment

Chart 3.4 関連
… Over the year Danish household debt fell significantly more than any other country examined, declining by 23.2 percentage points. In contrast to this, Swedish households saw a 4 percentage point increase over the same period as they climbed to become the third most indebted in the European Union, with a household debt level of 153.5 per cent of disposable income.

Chart 3.5 関連
… The reduction in financial assets over the quarter largely reflected a fall in transactions of insurance technical reserves. … The majority of households’ financial investments over the quarter were in the form of currency & deposits, while shares & other equity experienced positive transactions for the first time since Q4 2013.

Chart 3.6 関連
… This marked the first time since Q4 2013 that household deposit transactions with MFIs (monetary financial institutions) had declined. In contrast, households increased lodgements with government deposit accounts for the first time since Q1 2013.

Chart 3.7 関連
… Over recent quarters net lending has become increasingly driven by higher investment in financial assets, as opposed to deleveraging.

Household Net LendingBorrowing NFC Debt

4. Non-Financial Corporation Sector
Irish NFCs are significantly impacted by the activities of large MNCs. These latest NFC results incorporate the recent annual revisions to the CSO’s International Investment Position (IIP). The revisions include large MNCs which redomiciled to Ireland or moved significant parts of their balance sheets to Ireland during 2014 and 2015. These entities also contributed towards some of the very substantial increase in Irish GDP for 2015.

Chart 4.1 関連
… The decline in debt over the past year largely reflected exchange rate movements. Debt as a percentage of GDP fell from 327.5 per cent in Q1 2015 to 257.3 per cent in Q1 2016. This reflected both falling NFC debt, as well as, substantial GDP growth during 2015.

NFC Debt Comparison Loans AssetsLiabilities

Chart 4.2 関連
… Luxembourg, which also has a lot of large MNCs relative to the size of its economy, had the highest debt at 349 per cent of GDP. … how volatile Irish NFC debt to GDP has been in recent years compared to other euro area countries.

Chart 4.3 関連
… The substantial increase in debt held by non-residents reflects this corporate activity and explains why exchange rate movements have had a significant impact on NFC debt in some quarters. …debt held by Irish residents has been on a downward trend in recent years. …partly reflected NFC deleveraging with Irish MFIs.

Chart 4.4 関連
…largely reflected MNC activities. Net financial assets (financial assets minus liabilities) became even more negative since Q1 2015. This is because some MNCs had large non-financial assets or relocated substantial non-financial assets to Ireland.

New Zealand ニュージーランド Vol.3

ニュージーランド貿易・投資概観です。(Link in 1.(1)is in Japanese, and links in 2. are in English.)

1.(1)ニュージーランド(New Zealand)基礎データ 平成27年7月14日 の「経済」(以下、データは概ね2014年)の
「9.総貿易額」によると、
総額は1,010億NZドル、NZからの輸出は500億NZドル、NZへの輸入は510億NZドル、
となっています。
 また、「10.主要貿易品目」によると、
NZからの輸出は、酪農製品(32%)、食肉(13%)、木材(9%)、
NZへの輸入は、石油・鉱物燃料(15%)、自動車(13%)、機械類(12%)、
となっています。
 そして、「11.主要貿易相手国」によると、
総額は、中国(18.4%)、豪州(14.8%)、米国(10.5%)、日本(6.3%)、
NZからの輸出は、中国(19.9%)、豪州(17.5%)、米国(9.4%)、日本(5.9%)、
NZへの輸入は、中国(16.9%)、豪州(12.2%)、米国(11.6%)、日本(6.7%)、
となっています。

(2)「二国間関係」の「1.政治経済関係」によると、
「二国間の貿易」の総額は約5,419億円、NZから日本へは約2,910億円、日本からNZへは約2,509億円、
NZから日本への品目は、乳製品、木材、アルミニウム、肉類、果実類、野菜類、魚介類、
日本からNZへの品目は、自動車、石油、ブルドーザー類、印刷機、自動車部品類、
となっています。
 加えて、「日本からNZへの直接投資残高」は、2,604億円 となっています。

2.(1)「OUR SECTORS」| @NZTEnews (主要経済分野)として、
・ Agribusiness
・ Biotechnology
・ Geothermal *
・ Consultancy services
・ Creative, film and TV
・ Food and Beverage *
・ Health technology
・ High value manufacturing
・ Information and communications technology
・ Marine
・ Natural products *
・ Oil and gas
の12分野が挙げられ、それぞれに概要説明等が掲載されています(* は更なる分類等有り)。

(2)「EXPORT MARKETS」 | @NTZEnews として、世界各国につき概要説明があります。
 日本については、Japan | @NZTEnews において、
ニュージーランドからの輸出分野として、
・ Food and beverage
・ Healthcare
・ Renewable energy
・ Software, electronics, and engineering
が挙げられ、
FOOD AND BEVERAGE MARKET IN JAPAN | @NZTEnews
も掲載されています。また、

 オーストラリアについては、Australia | @NZTEnews において、
・ Food and beverage
・ Specialised manufacturing
・ Information and communications technology (ICT)
・ Creative and retail
が輸出分野として挙げられ、
NEW ZEALAND’S TRADE WITH AUSTRALIA | @NZTEnews なども掲載されています。

 アメリカについては、U.S. | @NZTEnews において、
・ Information and communications technology (ICT)
・ Public sector
・ Healthcare solutions
・ Bioactives
・ Food and beverage
・ Agribusiness
・ Marine and aviation
が輸出分野として挙げられ、投資についても少し触れられています。
また、FOOD AND BEVERAGE MARKET IN THE UNITED STATES | @NZTEnews なども掲載されています。

 カナダについては、Canada | @NZTEnews において、
・ Food and beverage
・ Wine and other alcoholic beverages
・ Manufactured goods and information technology(Aerospace、Marine、Utilities and infrastructure)
が輸出分野として挙げられ、
SUSTAINABILITY MARKET INTELLIGENCE IN NORTH AMERICA | @NZTEnews も掲載されています。

(3)「SECTORS OF OPPORTUNITY」| @NZTEnews(主要投資分野)として、
・ Food and beverage manufacturing
・ Primary production
・ Information and communication technology
・ High-value manufacturing
・ Infrastructure
・ Oil and gas
・ Shared services
の7分野が挙げられ、
それぞれに詳細な概要及び強みを持つ地方(“ニュージーランド Vol.2” の2.PDF)も掲載されています。

ツイッター paper.li Vol.4

All the below links are in English.

弊社ツイッターアカウントの一つ @WSjp_insight のRTによる paper.li 掲載記事7件を貼っておきます。

Irish economic growth | @RTEbusiness

Ireland’s national accounts | @ucddublin @Aidan_Regan

Soon Your Smart Car Will Also Be an Amazon Locker | @BloombergCA @ElisBehrmann @rweiss5

2016 @BSAnews GLOBAL CLOUD COMPUTING SCORECARD (pdf) | @invest_canada

IMF Backs More BOJ Easing If Coupled With Comprehensive Reforms | @business @RichMiller28

Nagasaki, 1945: “The world did not need your experiment” | @jricole

Rio 2016: What Olympic sports taught 8 leaders about successfully running a business | @Inc @JustinJBariso

Australia オーストラリア Vol.3

オーストラリア貿易・投資概観です。(Links except 2(4)are in Japanese.)

1.(1)オーストラリア連邦(Commonwealth of Australia)基礎データ 平成27年11月11日 の「経済」の「9 総貿易額及び主要貿易相手国」によると、オーストラリアの2013/14年度の
貿易総額は6,692億豪ドル、相手国は中国23.9%・日本10.8%・米国8.7%、
輸出額は3,312億豪ドル、相手国は中国32.5%・日本15.4%・韓国6.8%、
輸入額は3,380億豪ドル、相手国は中国15.4%・米国12.2%・日本6.3% となっています。
 また、「10 主要貿易品目」によると、
輸出は鉄鉱石(22.6%)・石炭(12.1%)・個人旅行サービス(9.0%)、
輸入は個人旅行サービス(8.2%)・原油(6.7%)・精製油(6.0%)
となっています。

(2)「二国間関係」の「3 経済関係」によると、日豪二国間貿易(2014年、財のみ)は、
貿易総額約6兆5,909億円、
輸出(日本→豪州)約1兆5,012億円、
輸入(豪州→日本)約5兆0,897億円、
となっています。
 また、主要品目は、
輸出(日本→豪州)では自動車(47.3%)・石油製品(16.4%)・電気機器(4.0%)・ゴムタイヤ及びチューブ(3.4%)・建設用鉱山用機械(2.7%)、
輸入(豪州→日本)では石油ガス類(33.0%)・石炭(26.2%)・鉄鉱石(17.8%)・非鉄金属鉱(4.3%)・牛肉(3.3%)、
となっています。
 そして、日本の対豪直接投資残高は約661億豪ドルとなっています。
 なお、日豪経済連携協定が2015年1月15日に発効しています。

ほか参考:
オーストラリア輸出統計(国・地域別) 最終更新日:2016年1月28日 | JETRO
世界経済のネタ帳 オーストラリアの貿易

2.(1)オーストラリアからの輸入 ー 産業情報 | @Austrade @AusUnlimited に主要分野として、
・ クリエイティブ(映画・テレビ、音楽産業、芸術・出版)
・ バイオテクノロジー
・ クリーンエネルギー・省エネ(概況、事例紹介、政策支援、ニュース)
・ インフラ・資源開発(建設、航空・空港、資源開発)
・ 金融サービス(アセット・ベース・ファイナンス/リース、ファンドマネジメント、ヘッジファンド、保険、投資銀行、支払・決済システム、プライベート・バンキング、プライベート・エクイティ/ベンチャー・キャピタル、リテール・バンキング)
・ 消費財(化粧品、ファッション、宝石)
・ 食品・飲料・農水産物(概要、農水産物、加工食品・飲料、ワイン、ネイティブ・フード、オーストラリア食品カタログ、食品関連ニュース)
・ 環境技術(グリーンビルディング・その他の環境技術のケーススタディ、その他オーストラリアの環境関連企業)
・ 医療機器とヘルスケア産業(治療機器及び手術用具・設備、ヘルスIT、保健インフラとサービス、臨床試験)
・ 情報通信技術(製品開発(R&D)施設、コンテンツ開発、技術支援センター、グローバルソーシング)
・ サービス産業(コンサルティング・アドバイザリー、法務サービス、物流、フランチャイズ)
・ スポーツ・オリンピック(2012年ロンドンオリンピック ~ スポーツ分野でのオーストラリア企業の成功例)
・ 資源技術・専門性
・ グローバル人材育成(多文化・多民族国家で世界に通じるグローバルなビジネススキルを習得できる;世界で最もグローバルな教育環境でグローバルなセンスを磨ける;グローバル化のニーズにあった研修プログラムが充実;安心して社員を送れる理想的な海外研修先)
が挙げられ、それぞれに概況や各種情報が掲載されています。

(2)また、オーストラリアへの投資 ー 分野別概況 | @Austrade @AusUnlimited には一覧として、
・ 再生可能エネルギー・環境(上記(1)「クリーンエネルギー・省エネ」)
・ エネルギー効率化
・ バイオ燃料
・ 風力発電
・ 太陽光発電
・ 鉱業と資源(豊富で多様な鉱物資源、高度な採掘装置・技術・サービス、投資のチャンス)
・ 水関連事業
・ 建築・建設(建築建設サービス、建築用品と材料、グリーンビル)
・ ICT産業(急成長を遂げるダイナミックな市場)
・ プロフェッショナル・ビジネスサービス
・ 金融サービス
・ バイオテクノロジー
・ 食品飲料
・ インフラ ~ 洗練されたPPP
・ 農林水産物
が挙げられ、それぞれに概況が掲載されています。

(3)なお、上記(1)及び(2)は、
・ クリーン(再生可能)エネルギー
・ インフラ(建設)
・ 情報通信技術(ICT)
・ 金融
・ (プロフェッショナル・ビジネス)サービス産業
・ 資源
・ 食品飲料・農水産物
・ バイオテクノロジー
などを共通して挙げています。

(4)Why Australia: Benchmark Report (PDF) の p.9: AUSTRALIA’S REAL GROSS VALUE ADDED BY INDUSTRY では、
・ Financial and Insurance 9.3%
・ Mining 9.3%
・ Construction 8.2%
・ Health Care and Social Assistance 7.0%
・ Manufacturing 6.6%
・ Professional, Scientific and Technical 6.4%
・ Education and Training 4.9%
・ Transport, Postal and Warehousing 4.9%
・ Information Media and Telecommunications 3.2%
・ Agriculture, Forestry and Fishing 2.4%
などとされています。
 また、同 p.10: GROWTH BY INDUSTRY IN AUSTRALIA’S REAL GROSS VALUE ADDED (All-Industries Average 3.2%) では、
・ Information Media and Telecommunications 5.3%
・ Professional, Scientific and Technical Services 5.0%
・ Construction 4.6%
・ Financial and Insurance Services 4.5%
・ Mining 4.4%
・ Health Care and Social Assistance 4.2%
・ Transport, Postal and Warehousing 3.5%
・ Agriculture, Forestry and Fishing 3.0%
などとされています。

 加えて(p.8,12,20,24,32,39,42,44,48,49,50,53を下に貼っておきます)、
p.8: PRODUCTIVITY OF AUSTRALIAN INDUSTRY SECTORS COMPARED WITH GLOBAL COMPETITORS
p.12: AUSTRALIA’S GLOBALLY SIGNIFICANT INDUSTRIES
p.13: AUSTRALIA’S ENERGY AND RESOURCES SECTOR
p.14: TOP 10 EXPORT DESTINATIONS FOR AUSTRALIAN FOOD AND FIBRE
p.16: DISTRIBUTION OF FOREIGN STUDENTS IN TERTIARY EDUCATION BY COUNTRY OF DESTINATION – 2013
p.17: GLOBAL SIGNIFICANCE OF AUSTRALIA’S INVESTMENT FUND ASSETS POOL
p.20: HOW AUSTRALIA COMPARES WITH LEADING OECD COUNTRIES: KEY INNOVATION INDICATORS
p.22: WORLD OF RESEARCH AND DEVELOPMENT
p.24: RELATIVE IMPACTS OF AUSTRALIAN SCIENTIFIC PUBLICATIONS BY RESEARCH FIELD
p.30: AUSTRALIA’S EMPLOYED PERSONS BY INDUSTRY – 2015
p.32: GLOBAL TALENT COMPETITIVENESS RANKING – 2014
p.36: FOREIGN-BORN POPULATION
p.39: AUSTRALIA’S TRADE BY BROAD SECTOR AND TOP FIVE COMMODITIES
p.42: TOTAL FOREIGN INVESTMENT STOCK IN AUSTRALIA – 1995–2015
p.43: AUSTRALIA’S SHARE OF GLOBAL FOREIGN DIRECT INVESTMENT STOCK – 2004–14
p.44: MAIN SOURCES OF FOREIGN DIRECT INVESTMENT STOCK IN AUSTRALIA – 2009–14
p.48: INDEX OF ECONOMIC FREEDOM WORLD RANKING – 2015
p.49: KEY INDICATORS OF EASE OF DOING BUSINESS
p.50: GLOBAL PRIME OFFICE OCCUPANCY COSTS – 2015
p.51: REMUNERATION OF MANAGEMENT
p.52: BUSINESS EFFICIENCY AND ENVIRONMENT – 2015
p.53: WORLDWIDE GOVERNANCE INDICATORS
など各種の有用なデータが含まれています。
p.8p.12p.20p.24p.32p.39p.42p.44p.48p.49p.50p.53