Julian Lorkin’s interview with Shanghai-born Vic Edwards, a visiting fellow in the school of banking and finance at UNSW Business School and a part-time professorial visiting fellow at China Youth University of Political Studies in Beijing.
Troubled waters: Vic Edwards on the dispute in the South China Sea (w Video; August 17, 2016) | @JLorkin @UNSWbusiness
豪ニューサウスウェールズ大学や中国青年政治学院に籍を置く、上海生まれ中国系有識者のインタビュービデオ(上記link)抜粋・下線・抄訳です。
BusinessThink (@JLorkin): The Permanent Court of Arbitration’s ruling at The Hague in July has been rather coolly received, at least in China. It deals with thorny issues [of historic rights and the source of maritime entitlements] in the South China Sea, through which much of the world’s trade passes.
The question is, should Australia be worried and should China be concerned, particularly as the Chinese economy starts to cool? Let’s start with what China is calling the nine-dash line. What is the historical basis for their claims?
Vic Edwards: … So the US switched their allegiances to Japan and managed to persuade Japan to come on the side of the US, even though they were deadly enemies before that. And that was on the basis that they would save the life of the emperor, Hirohito, who was a godlike character in Japan. So by offering that as an olive branch, so to speak, Japan came onside with the US and with Great Britain in 1952.
(… 殺し合う敵だったのにアメリカが日本を同盟国に引き入れることができたのは、日本で神格化されていた天皇ヒロヒトをアメリカが救ったからだ。…)
Over quite a long period there hasn’t been a great deal of difficulty and I think the position that China took was when you had the Permanent Court of Arbitration say that it wanted to arbitrate on the matter, China saw clearly that the international law of the sea, which they had interpreted as accepting their position of having the South China Sea, was therefore up for arbitration and dispute. Consequently, they decided not to submit themselves to the jurisdiction of the UN and the Permanent Court of Arbitration.
(中国は本件で長期間大きな困難がなく、中国は国際海洋法条約が南シナ海を有するという中国の立場を受け入れると明快に分かったので、仲裁裁判へと進んだ。…)
Now, that might have been their weak point because the court would have said that they were in fact subject to the jurisdiction of The Hague, whereas they had decided to withdraw from it because they felt that their position had been misrepresented. It’s not that they’re without support. They do have about half a dozen to a dozen countries that would give them some support on the matter.
(… 中国の立場が反映されていないと感じているので取り下げようと決めたのに、ハーグの常設仲裁裁判所が本件の中国は裁判管轄権下にあると言いそうだった点が中国の弱点だったかもしれない。中国を支持する国は5、6から12くらいある。)
And they are asking Australia to be very careful about drawing any conclusions or trying to make a judgment about what China should do. So we have already had one or two statements from Australia that China should comply with international law and they have responded by saying Australia ought to be careful because while we do have an international agreement for trade, that can very easily be dismantled.
(中国はオーストラリアに、中国がどうすべきかに係る結論やなにがしかの判断をする際に、非常に注意深くあることを求めている。既にオーストラリアは中国が国際法を遵守するべきである旨の1、2の声明を出しており、これを受けて中国はオーストラリアに、非常に容易に廃棄され得る豪中貿易合意があるので、オーストラリアは注意深くあらねばならないと応えている。)
BusinessThink: It sounds as if Australia could be in a position of trying to calm down the situation. Indeed, Australia could actually just pour a little bit of oil on those very troubled waters?
Edwards: … So I think that that’s a very positive thing between Australia and China, but by the same token Australia also has a very strong allegiance to the US. So consequently, I think one of the problems that Australia has is that it may be doing the beckoning of the US.
I think one of the problems that Australia has is that it may be doing the beckoning of the US.
The US, you might notice, has not actually come out strongly and criticised China on this matter, not directly. There are a few minor officials that have done so but you haven’t found Barack Obama coming out. And I think one of the reasons is that America itself does not comply with the international law of the sea and in fact it has not submitted itself to the jurisdiction of the UN here so it would be quite hypocritical if they were to criticise China in that position.
(お気付きかもしれないが、アメリカは実際本件について強く出たり中国を批判したりしていない。… アメリカ自体が国際海洋法条約を批准していないことがその理由の一つであると思う。アメリカは海洋について国連の裁判管轄権下にない。だから、アメリカが中国を批判すると、かなり偽善的となろう。)
BusinessThink: It’s a dangerous game to be playing, particularly as so much of the world’s trade goes through those areas. And we’ve seen, since the judgment, that a lot of people are quite concerned about what the possible outcomes could be. What would be the implications if, say, world trade was disrupted?
Edwards: … They’re saying that they’re not going to stop trade, they’re not going to stop fishing, they’re not going to stop peaceful planes from flying over the South China Sea. That will be continued just as it has been since 1948.
BusinessThink: Also in the area we’ve got Japan which has previously been – let’s call them neutral for the sake of a better word – for many, many years since World War II. But now, of course, we’ve got the rise of a much more dominant Japan. Could that throw a spanner in the works?
Edwards: Well, that would be something that could be an undesirable eventuality. Japan has been peaceful because part of the 1952 agreement with the US and the UK was that Japan would not under any circumstances have any armaments, would not have an army, navy or air force. Now, Prime Minister Shinzo Abe has recently suggested that Japan needs to go back to a more defensive footing. Part of his excuse is China’s perceived aggression – and he may have some argument there.
(… 日本が平和的であったのは、1952年の米英との合意により、日本は非武装で陸軍海軍空軍いずれも持たないこととされたからだ。安倍晋三首相は、最近、日本はもっと国防に力を入れる軸足に立ち戻らねばならないと示唆している。その言い訳の一つは、認識されている中国の武力侵略である。…)
However, he has just recently got a majority in the Upper House – I think he’s even got his two-thirds majority – so he can in fact form an army, navy and air force. And he has said that he would like to form at least the army and perhaps the navy before 2018, which is the end of his term. So we won’t know what will happen then, but I would hope that nothing would happen in terms of having armaments, having any sort of warfare, having any sort of skirmishes. I don’t think that would be helpful to anyone and I really think it would be a lose/lose situation all round.
(しかし、彼はつい最近参議院で過半数を得てしまった。三分の二の賛成も得ると思う。そうすると、陸軍海軍空軍を創ってしまう。そして、彼曰く、自分の任期が終わる2018年より前に、少なくとも陸軍は創りたい、多分海軍もということである。武装や交戦、小競り合いはあって欲しくない。誰にとっても得でないルーズ=ルーズ状態だからだ。)
BusinessThink: All this controversy is happening just as the Chinese economy is slowing. What’s happening there?
Edwards: Well, I think we’ve had the global financial crisis; that’s one of the main factors that’s occurring. And also China is trying to transition from being an export-oriented economy to a consumption economy. Those two factors were always felt to slow down China and China had planned on transitioning from about 11.5% growth rate to about 7.5 % growth rate. But currently it’s running at around about 6.7%, so it’s a little bit under what it has planned for.
I think we should see it in perspective. That 6.7% is about twice as much as any other economy in the world and of course China is the big growth factor in the world.
(世界金融危機と、中国の貿易(外需)依存型経済から消費(内需)依存型経済への移行が、中国の経済成長を鈍化させている。目標成長率を11.5%から7.5%に下げているが、今の成長率はそれに少し足りない6.7%となっている。)
Without China, the whole world would probably slump into another recession.
So what China feels should be done is that countries such as the US and the EU should try to pick up their demand for things. And as recently as two weeks ago, the G20 countries agreed that they would try to improve demand. But they didn’t have any specific targets to meet so I’m not sure whether they will do very much.
(… G20は具体的な達成目標を示さなかったので、成果があったかどうか分からない。)
The US also is at present concerned about its trade with China, about the outsourcing of jobs to China, and particularly with Donald Trump [saying] he would like to not have any outsourcing and he would like to have local employment, etc, in the US. So the outlook is not great. China is still saying that it will meet its 6.5% to 7% target and it is endeavouring to do so, but I think that they will have a little bit of difficulty, but they will still be well above the world’s norm of around about 3.5%.
(… ドナルド・トランプは中国に雇用をアウトソーシングさせず、アメリカ国内のローカルな雇用を生むようにしたがっている。そうすると、中国経済の見通しは良くない。中国は引き続き6.5%から7%という目標を達成すべく努力するが、少々難しく、それでも世界平均を充分上回る3.5%程度の成長に落ち着くと見ている。)
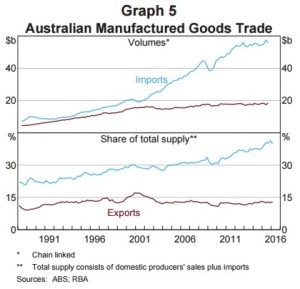
So Australia can still see that it will do well. In fact, in such things as coal, minerals, iron ore and agricultural produce, demand from China has picked up. But of course the prices are lower, so we don’t get quite the same bang that we used to.