(All the below links are in English.)
オーストラリア中央銀行 Reserve Bank of Australia の 2016年第2四半期 Bulletin June Quarter 2016 | @RBAInfo をご紹介します。
1. Household Wealth in Australia: Evidence from the 2014 HILDA Survey | Paul Ryan and Tahlee Stone(オーストラリア国民の家計の財産状態)
[概要abstract]
This article uses data from the Household, Income and Labour Dynamics in Australia (HILDA) Survey* to assess how the distribution of wealth changed for Australian households between 2010 and 2014. Average household wealth increased modestly over that period, driven mainly by growth in the value of financial assets, most notably superannuation. The growth of housing wealth was slow in comparison, particularly in Queensland and Western Australia. While most of the changes in wealth were broadly based across households, wealth increased more rapidly for those residing in New South Wales and for retired households with large holdings of superannuation and equity assets.
(本論文は、オーストラリア家計収入労働関係性HILDA調査のデータを使って、2010年から2014年の間のオーストラリア国民の富の分配の変化を評価している。この期間、主に、金融資産価値、最も知られているものでは退職年金の増加によって、平均的な家計の富は緩やかに増加した。特にクイーンズランド州や西オーストラリア州では伸びは鈍い一方、ニューサウスウェールズ州では急速に伸びた。)
** Australian System of National Accounts (ASNA)
*** Australian Bureau of Statistics (ABS) Survey of Income and Housing (SIH)
[補足・抜粋/excerpts]
Introduction
… As the general distribution of household wealth (i.e. total assets minus total debts) across, these categories is broadly the same in 2014 as it was in 2010, this article focuses on how the distribution of housing assets (including investment properties), non-housing assets (predominately superannuation) and household debt have changed between 2010 and 2014.
The HILDA Survey* data suggest that the average Australian household had total wealth of around $740 000 in 2014. Measures of real (inflation adjusted) wealth per household from the HILDA Survey grew a little less over the decade to 2014 than measures based on household-level data from the SIH*** and distributional wealth indicators from the ABS that are consistent with aggregate data from the ASNA** (Graph 1).
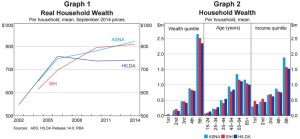
Looking at the cross-sectional distribution of household wealth, older and higher-income households tend to have higher levels of wealth (Graph 2). …
Household Wealth
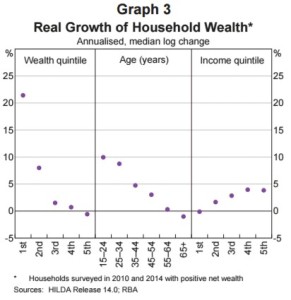
Overall, almost 60 per cent of households in the HILDA Survey had more real wealth in 2014 than was the case in 2010. Households with the lowest levels of wealth in 2010 saw the most growth of wealth over the four years to 2014 (Graph 3). This partly reflects the fact that low-wealth households are generally young and are just starting to build wealth. …
… most of the increase in wealth over the 2010–14 period came from growth in the value of non-housing assets, which are predominantly financial assets such as superannuation, equities and deposits (Graph 4). …
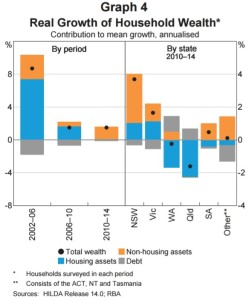
… Households in New South Wales and Victoria saw the largest increase in wealth, with growth in both housing and non-housing assets, while households in Queensland and Western Australia saw the biggest decrease in wealth, on average, mainly owing to a fall in the value of housing assets. The other states and territories generally saw relatively little growth in wealth over the period. The outcomes for households in Queensland and Western Australia are likely to have been influenced by the decline in commodity prices and the mining investment boom following the peak, which occurred between 2010 and 2014. …
Housing Assets
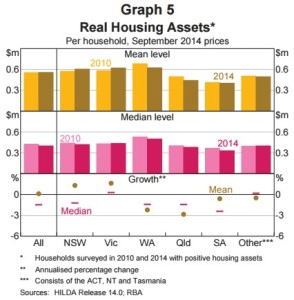
Housing is the largest asset class on Australian households’ balance sheets, accounting for around 60 per cent of total assets. Over any given period, growth in housing assets can be due to a change in housing prices or a change in the stock of housing held by Australian households. …Looking more closely across the states reveals large differences in the mean and median values of housing assets (Graph 5). …
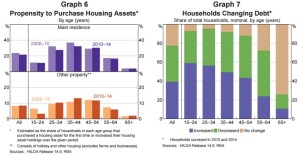
… the share of households that either became home owners for the first time or upgraded their main residence decreased relative to the 2006–10 period (Graph 6). …Households in New South Wales and Victoria were slightly more likely to increase their holdings of other property than was the case from 2006 to 2010.
Household Debt
… High-income households hold the majority of debt. The top income quintile held almost 50 per cent of the stock of household debt in 2014. Almost a third of households held no debt, with the majority of these being retired households.
Over the four years to 2014, about 40 per cent of households increased their levels of nominal debt, while a similar share of households reduced their holdings of debt (Graph 7). …
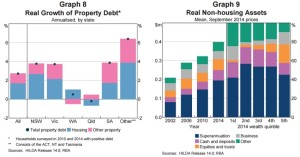
Property debt accounted for a little over 80 per cent of the stock of debt held by households in 2014. Average debt increased modestly from 2010 to 2014, by a little more than 2 per cent per year (Graph 8). …
Non-housing Assets
… The mean value of real non-housing assets increased from around $320,000 in 2010 to almost $400,000 in 2014 (Graph 9). … Wealthier households held a higher-than-average share of assets in the form of direct equity holdings and business assets, while households with lower net wealth held more in cash and deposits, superannuation and durable goods (Graph 9).
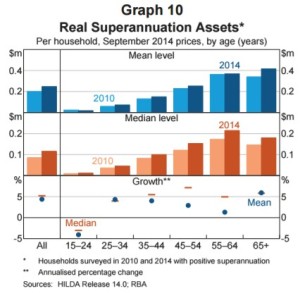
The mean superannuation balance grew by around 4 per cent per annum in real terms for all households over the period to $250,000 in 2014 (Graph 10). … The noticeably stronger growth in median superannuation assets relative to the mean for households aged 45 to 64 years suggests that the ‘typical’ (or median) household in these age groups are building up superannuation assets faster in the lead-up to retirement than the households in the same age group with the largest balances of superannuation (Graph 10).
Conclusion
… The main driver of growth in household wealth over that period was an increase in the value of financial assets, mostly superannuation assets. Weaker growth in housing wealth, with declines in Queensland and Western Australia, contributed to the slower growth in total wealth from 2010–14. …
2. Conditions in the Manufacturing Sector | Sean Langcake(製造業界の現状)
[概要abstract]
Manufacturing output and employment have fallen steadily as a share of the Australian economy for the past three decades. This article looks at the composition of the sector and draws on the Reserve Bank’s liaison with manufacturers to provide an insight into some of their responses to the structural challenges in recent years. According to liaison, the increase in the supply of manufactured goods from low-cost sources abroad, exacerbated by the appreciation of the Australian dollar during the period of rising commodity prices, impaired the viability of many domestic manufacturers and precipitated the closure of some manufacturing production over the past decade. While the recent exchange rate depreciation has helped to improve competitiveness of Australian producers, so far there is only limited evidence of a recovery in manufacturing output and investment.
(オーストラリア経済において、製造業の生産と雇用は、過去三十年着実に低下してきている。ここでは、近年の経済構造の変化への製造業者の対応を洞察する。コモディティ価格上昇期に豪ドル高となったため、低コスト製品が海外から流入し、それがオーストラリア国内製造業者の価値を損ない、過去十年の製造業者閉鎖を促進した。最近の為替レート低下によりオーストラリア製造業者の競争力は改善されている一方、製造業者の生産と投資が回復してきている証拠はまだ限定的である。)
[補足・抜粋/excerpts]
Introduction
… It currently accounts for around 7 per cent of total output and employment. … over the 2000s, strong Asian demand for Australian commodities led to a sharp increase in the terms of trade and an appreciation of the Australian dollar. …
Manufacturing in Australia
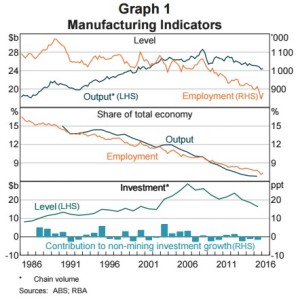
Manufacturing output increased steadily throughout most of the 1990s before plateauing in the early 2000s; output today is around the same level it was just over a decade ago (Graph 1). … Over the past two decades, the Australian economy as a whole has grown considerably, resulting in a marked decline in manufacturing output as a share of total output. Employment in manufacturing has also declined over the past two decades, with growth in labour productivity in line with that of the economy as a whole. …
…investment in the manufacturing sector has also fallen steadily since its peak in 2005/06 (Graph 1). …
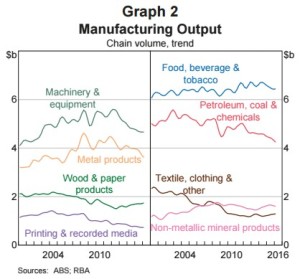
Australia’s manufacturing sector is quite diverse and is comprised of several sub-industries, the largest being: food, beverage & tobacco; machinery & equipment; petroleum, coal & chemicals; and metal products (Graph 2). …
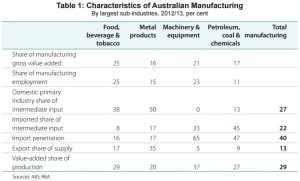
The food, beverage & tobacco and metal products sub-industries both rely heavily on inputs from primary industries (agriculture and mining) where Australia has an abundant supply, and use a relatively low share of intermediate components that are imported. …
Conversely, the machinery & equipment and petroleum, coal & chemicals sub-industries use relatively few inputs from primary industries in Australia and have a relatively high share of imported intermediate components. …
The International Context
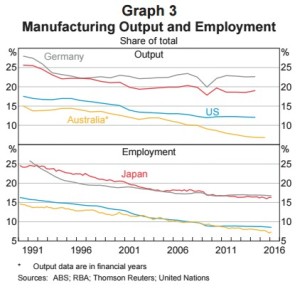
Over the past 25 years, most advanced economies have seen their manufacturing sectors recede as a share of both output and employment, although Australia has generally had a lower share than many other advanced economies (Graph 3).
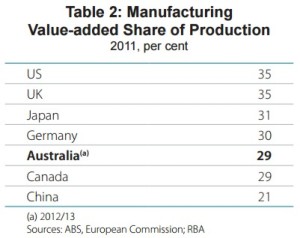
The ratio of value added to total production in the Australian manufacturing sector is broadly comparable to that in other advanced economies’ manufacturing industries (Table 2). Relative to other Australian industries, manufacturing is a low value-added sector; the ratio of value-added to total production (29 per cent) is the lowest of any industry. …
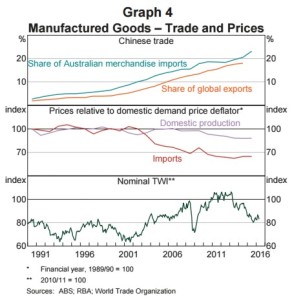
… The steady increase in China’s share of Australia’s merchandise imports has coincided with a fall in the prices of imported manufactured goods relative to domestic production (Graph 4).
The Australian Dollar and Implications for Competitiveness
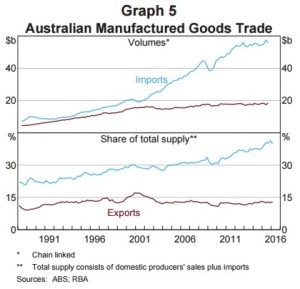
The appreciation of the Australian dollar from 2000 to 2013 worked against the international competitiveness of Australian manufacturing (Graph 4). Exports of Australian manufactured goods grew slowly over this period as they became relatively more expensive overseas (Graph 5). …
… Typically, contacts maintain some productive capacity in Australia, either as a testing or research and development (R&D) facility, to protect their more sensitive intellectual property, or to be able to fill orders more quickly. Nevertheless, firms that have ‘offshored’ production typically have much less productive capacity remaining in Australia than their overseas operations. …
…there are significant lags between a depreciation of the dollar and a response in manufacturing production and exports due to the nature of supply chains. For instance, even though domestic producers have become more competitive against imported products, retailers or other manufacturers may have contracts that secure supply in advance, which inhibits their ability to switch to domestically produced products. …
…they responded to the appreciation of the dollar by importing more goods, either by choice or necessity as production of some inputs had moved offshore. … while the lower value of the dollar aids demand, margins are under pressure due to rising import costs in instances where local substitutes are not readily available.
Domestic Input Costs and Implications for International Competitiveness
… Australian manufacturing labour costs appear to be relatively high compared with those in other economies – a feature that has become more pronounced over time (Graph 6). …
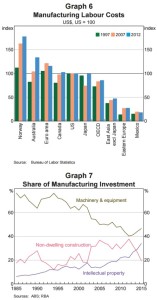
…firms have been looking to find labour productivity gains by automating some production processes. They have also been developing new products to diversify their offering. These shifts are borne out in the nature of firms’ investments; increasingly, manufacturers are investing in intellectual property rather than physical capital (Graph 7). …
…foreign-owned manufacturing firms operating in Australia are more willing to invest in R&D than physical capital in their Australian subsidiaries, although it is difficult to quantify what share of manufacturing activity is accounted for by these firms. …
Difficulties Integrating in Supply Chains
…other economies have responded to pressure from cheaper, imported manufactured goods by integrating themselves more effectively into increasingly fragmented global supply chains. … Australia’s geographic isolation contributes to high trade costs and presents a significant impediment to greater participation in global supply chains. …the costs of trading Australia’s manufactured goods – largely international transport costs – are in the order of 20–25 per cent higher than the global average. … only 4 per cent of manufacturing firms are part of an integrated supply chain.
…Australia’s relatively high trade costs leave domestic producers primarily exposed to the relatively small domestic market and unable to benefit from the scale advantages that other advanced economies achieve through production for larger domestic markets and export markets. …around 45 per cent of the difference between US and Australian non-farm labour productivity levels can be explained by Australia’s geographic isolation. High trade costs may also protect less productive domestic firms from import competition, although this protection is likely to have been eroded through time by lower international search and transaction costs. …
Conclusion( )内は抄訳
The depreciation of the Australian dollar over recent years has helped to improve the competitiveness of Australian manufacturing. Additionally, there is likely to be a steady level of activity in the food, beverages & tobacco sub-industry due to Australia’s comparative advantage in primary resources and growing export demand. Against this, softer demand from the mining sector and the cessation of passenger vehicle production will weigh on output, although motor vehicle and transport equipment production currently makes up only around 5 per cent of manufacturing output.
(豪ドル安は製造業の競争力を向上させてきた。食品飲料煙草が伸びた反面、鉱業の鈍い伸びや乗客用乗物の製造中止は今後製造に重くのし掛かるであろう。)
In the longer term, the structural challenges facing the Australian manufacturing sector are likely to constrain output. Declining global prices for manufactured goods and the sustained high level of the Australian dollar during the resource investment boom impaired the viability of many Australian manufacturers and precipitated considerable structural change in the sector, with numerous manufacturers either closing or shifting production to lower-cost economies. R&D operations are one area where Australia’s cost disadvantages are less of an impediment and our highly skilled workforce is a comparative advantage. Although R&D investment has been growing steadily, the subsequent demand for labour and, in particular, physical capital are likely to be less than was generated by ‘traditional’ manufacturing activities.
(長期的には、オーストラリア製造業の構造的課題は製造を抑える。製造業の製品の世界的な価格低下と、資源ブームの間高止まりした豪ドルは、オーストラリアの多くの製造業者の生命力を削ぎ、廃業か低コスト国での生産へのシフトにより製造業界の構造変化を早めた。R&Dはオーストラリアのコスト面での不利がさほど問題にならない分野であり、熟練度の高い労働力が比較優位となっている。R&Dへの投資の伸びは堅調であるが、R&Dにおける引き続く労働力の需要ととりわけ物的資本の需要は’伝統的’製造業における需要よりは少なそうである。)

“Australia オーストラリア Vol.4” への 1 件のフィードバック
コメントは受け付けていません。